
10.5.2 Chemical Vapor Deposition
The mechanisms by which CVD occurs are very similar to those of heterogeneous catalysis discussed earlier in this chapter. The reactant(s) adsorbs on the surface and then reacts on the surface to form a new surface. This process may be followed by a desorption step, depending on the particular reaction.
The growth of a germanium epitaxial film as an interlayer between a gallium arsenide layer and a silicon layer has received attention in the microelectronics industry.19 Epitaxial germanium is also an important material in the fabrication of tandem solar cells. The growth of germanium films can be accomplished by CVD. A proposed mechanism is

At first it may appear that a site has been lost when comparing the right- and left-hand sides of the surface reaction step. However, the newly formed germanium atom on the right-hand side is a site for the future adsorption of H2(g) or GeCl2(g), and there are three sites on both the right- and left-hand sides of the surface reaction step. These sites are shown schematically in Figure 10-21.
Figure 10-21. CVD surface reaction step for Germanium.

The surface reaction between adsorbed molecular hydrogen and germanium dichloride is believed to be rate-limiting. The reaction follows an elementary rate law with the rate being proportional to the fraction of the surface covered by GeCl2 times the square of the fraction of the surface covered by molecular hydrogen.
![]()

The deposition rate (film growth rate) is usually expressed in nanometers per second and is easily converted to a molar rate (mol/m2 · s) by multiplying by the molar density of solid germanium (mol/m3).
The difference between developing CVD rate laws and rate laws for catalysis is that the site concentration (e.g., Cv) is replaced by the fractional surface area coverage (e.g., the fraction of the surface that is vacant, fv). The total fraction of surface available for adsorption should, of course, add up to 1.0.
![]()
We will first focus our attention on the adsorption of GeCl2. The rate of jumping on to the surface is proportional to the partial pressure of GeCl2, PGeCl2, and the fraction of the surface that is vacant, fv. The net rate of GeCl2 adsorption is

Since the surface reaction is rate-limiting, in a manner analogous to catalysis reactions, we have for the adsorption of GeCl2
![]()
Solving Equation (10-84) for the fractional surface coverage of GeCl2 gives
![]()
For the dissociative adsorption of hydrogen on the Ge surface, the equation analogous to (10-84) is

Since the surface reaction is rate-limiting,
![]()
Then

Recalling the rate of deposition of germanium, we substitute for fGeCl2 and fH in Equation (10-82) to obtain
![]()
We solve for fv in an identical manner to that for Cv in heterogeneous catalysis. Substituting Equations (10-85) and (10-87) into Equation (10-83) gives
![]()
Rearranging yields
![]()
Finally, substituting for fv in Equation (10-88), we find that
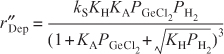
and lumping KA, KH, and kS into a specific reaction rate k′ yields

We now need to relate the partial pressure of GeCl2 to the partial pressure of GeCl4 in order to calculate the conversion of GeCl4. If we assume that the gas-phase reaction
![]()
is in equilibrium, we have

and if hydrogen is weakly adsorbed ![]() , we obtain the rate of deposition as
, we obtain the rate of deposition as

We now can use stoichiometry to express each of the species’ partial pressures in terms of conversion and the entering partial pressure of GeCl4, PGeCl4, 0, and then proceed to calculate the conversion.
It should also be noted that it is possible that GeCl2 may also be formed by the reaction of GeCl4 and a Ge atom on the surface, in which case a different rate law would result.

10.6 Model Discrimination
We have seen that for each mechanism and each rate-limiting step we can derive a rate law. Consequently, if we had three possible mechanisms and three rate-limiting steps for each mechanism, we would have nine possible rate laws to compare with the experimental data. We will use the regression techniques discussed in Chapter 7 to identify which model equation best fits the data by choosing the one with the smaller sums of squares and/or carrying out an F-test. We could also compare the residual plots for each model, which not only show the error associated with each data point but also show if the error is randomly distributed or if there is a trend in the error. If the error is randomly distributed, this result is an additional indication that the correct rate law has been chosen.

We need to raise a caution here about choosing the model with the smallest sums of squares. The caution is that the model parameter values that give the smallest sum must be realistic. In the case of heterogeneous catalysis, all values of the adsorption equilibrium constant must be positive. In addition, if the temperature dependence is given, because adsorption is exothermic, the adsorption equilibrium constant must decrease with increasing temperature. To illustrate these principles, let’s look at the following example.
Example 10-3. Hydrogenation of Ethylene to Ethane
The hydrogenation (H) of ethylene (E) of form ethane (EA),
H2 + C2H4 → C2H6
is carried out over a cobalt molybdenum catalyst [Collect. Czech. Chem. Commun., 51, 2760 (1988)]. Carry out a nonlinear regression analysis on the data given in Table E10-3.1, and determine which rate law best describes the data.
Table E10-3.1. Differential Reactor Data
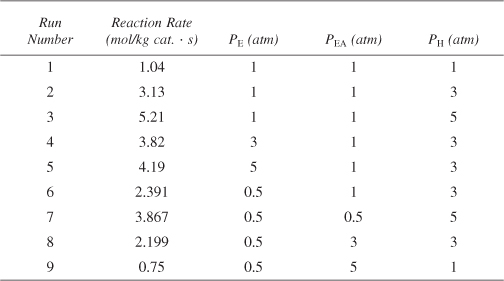
Determine which of the following rate laws best describes the data in Table E10-3.1.
a. ![]()
b. ![]()
c. ![]()
d. ![]()

Polymath was chosen as the software package to solve this problem. The data in Table E10-3.1 were typed into the system. A screen-shot by screen-shot set of instructions on how to carry out the regression is given in the DVD-ROM/Web Summary Notes for Chapter 7. After entering the data and following the step-by-step procedures, the results shown in Table E10-3.2 were obtained.
Table E10-3.2. Results of the Polymath Nonlinear Regression


Model (a)
From Table E10-3.2 data, we can obtain
![]()
We now examine the sums of squares (variance) and range of variables themselves. The sums of squares is reasonable and in fact the smallest of all the models at 0.0049. However, let’s look at KEA. We note that the value for the 95% confidence limit of ± 0.0636 is greater than the nominal value of KEA = 0.043 atm–1 itself (i.e., KEA = 0.043 ± 0.0636). The 95% confidence limit means that if the experiment were run 100 times and then 95 times it would fall within the range (–0.021) < KEA < (0.1066). Because KEA can never be negative, we are going to reject this model. Consequently, we set KEA = 0 and proceed to Model (b).
Model (b)
From Table E10-3.2 we can obtain
![]()
The value of the adsorption constant KE = 2.1 atm–1 is reasonable and is not negative within the 95% confidence limit. Also, the variance is small at ![]() .
.
Model (c)
From Table E10-3.2 we can obtain
![]()
While KE is small, it never goes negative within the 95% confidence interval. The variance of this model at ![]() is much larger than the other models. Comparing the variance of model (c) with model (b)
is much larger than the other models. Comparing the variance of model (c) with model (b)
![]()
We see that the ![]() is an order of magnitude greater than
is an order of magnitude greater than ![]() , and therefore we eliminate model (c).20
, and therefore we eliminate model (c).20
Model (d)
Similarly for the power law model, we obtain from Table E10-3.2
![]()
As with model (c) the variance is quite large compared to model (b)
![]()
So we also eliminate model (d). For heterogeneous reactions, Langmuir-Hinshelwood rate laws are preferred over power law models.
Analysis: Choose the Best Model. In this example we were presented with four rate laws and were asked which law best fits the data. Because all the parameter values are realistic for model (b) and the sums of squares are significantly smaller for model (b) than for the other models, we choose model (b). We note again that there is a caution we need to point out regarding the use of regression! One cannot simply carry out a regression and then choose the model with the lowest value of the sums of squares. If this were the case, we would have chosen model (a), which had the smallest sums of squares of all the models with σ2 = 0.0049. However, one must consider the physical realism of the parameters in the model. In model (a) the 95% confidence interval was greater than the parameter itself, thereby yielding negative values of the parameter, KAE, which is physically impossible.
Summary
- Types of adsorption:
a. Chemisorption
b. Physical adsorption
- The Langmuir isotherm relating the concentration of species A on the surface to the partial pressure of A in the gas phase is

- The sequence of steps for the solid-catalyzed isomerization

is:
a. Mass transfer of A from the bulk fluid to the external surface of the pellet
b. Diffusion of A into the interior of the pellet
c. Adsorption of A onto the catalytic surface
d. Surface reaction of A to form B
e. Desorption of B from the surface
f. Diffusion of B from the pellet interior to the external surface
g. Mass transfer of B away from the solid surface to the bulk fluid
- Assuming that mass transfer is not rate-limiting, the rate of adsorption is

The rate of surface reaction is

The rate of desorption is

If there are no inhibitors present, the total concentration of sites is

- If we assume that the surface reaction is rate-limiting, we set

and solve for CA · S and CB · S in terms of PA and PB. After substitution of these quantities in Equation (S10-4), the concentration of vacant sites is eliminated with the aid of Equation (S10-7):

Recall that the equilibrium constant for desorption of species B is the reciprocal of the equilibrium constant for the adsorption of species B:

and the thermodynamic equilibrium constant, KP, is

- Chemical vapor deposition:


DVD-ROM Material
- Summary Notes for Chapter 10
- Interactive Computer Games
Heterogeneous Catalysis


- Solved Problems
Example DVD10-1 Analysis of a Heterogeneous Reaction [Class Problem University of Michigan]
Example DVD10-2 Least Squares Analysis to Determine the Rate Law Parameters k, kT, and kB
Example DVD10-3 Decay in a Straight-Through Reactor
Example DVD10-4 Catalyst Poisoning in a Batch Reactor

• Living Example Problems
- Example 10-2 Regression Analysis to Determine Model Parameters
- Example 10-3 Fixed-Bed Reactor Design
- Example 10-4 Model Discrimination
- Example DVD10-6 Catalyst Decay in a Fluidized Bed Modeled as a CSTR
- Example DVD10-8 Decay in a Straight-Through Transport Reactor
• Professional Reference Shelf
R10.1. Classification of Catalysts
R10.2. Hydrogen Adsorption
A. Molecular Adsorption
B. Dissociative Adsorption
R10.2. Analysis of Catalyst Decay Laws
A. Integral Method
B. Differential Method

• R10.3. Etching of Semiconductors
A. Dry Etching
B. Wet Etching
C. Dissolution Catalysis
R10.4. Catalyst Deactivation
A. Type of Catalyst Deactivation
B. Temperature-Time Trajectories
D. Straight-Through Transport Reactors
After Reading Each Page in This Book, Ask Yourself a Question About What You Read
Questions and Problems
The subscript to each of the problem numbers indicates the level of difficulty: A, least difficult; D, most difficult.
![]()

Read over the problems at the end of this chapter. Make up an original problem that uses the concepts presented in this chapter. See Problem P5-1A for guidelines. To obtain a solution:
a. Create your data and reaction.
b. Use a real reaction and real data.
The journals listed at the end of Chapter 1 may be useful for part (b).
c. Choose an FAQ from Chapter 10 and say why it was most helpful.
d. Listen to the audios ![]() on the DVD-ROM and pick one and say why it was most helpful.
on the DVD-ROM and pick one and say why it was most helpful.
a. Example 10-1. Plot and analyze (1) the ratio of toluene-occupied sites to benzene-occupied sites (2) the fraction of vacant sites and (3) the fraction of benzene-occupied sites as a function of conversion at 1 atm.
b. Example 10-2. (1) What if the entering pressure were increased to 80 atm or reduced 1 atm, how would your answers change? (2) What if the molar flow rate were reduced by 50%, how would X and y change? (3) What catalyst weight would be required for 60% conversion?
c. Example 10-3. (1) How would your answers change if the following data for Run 10 were incorporated in your regression table?
![]() cat · s, PE = 0.5 atm, PEA = 15 atm, PH = 2 atm.
cat · s, PE = 0.5 atm, PEA = 15 atm, PH = 2 atm.
(2) How do the rate laws (e) and (f)
![]()
compare with the other rate laws use to model the data?
d. Write a question for this problem that involves critical thinking and explain why it involves critical thinking.
Load the Interactive Computer Games (ICG) from the DVD-ROM. Play the game and then record your performance number for the game, which indicates your mastering of the material. Your professor has the key to decode your performance number.
ICG Heterogeneous Catalysis Performance # _____________.
t-Butyl alcohol (TBA) is an important octane enhancer that is used to replace lead additives in gasoline [Ind. Eng. Chem. Res., 27, 2224 (1988)]. TBA was produced by the liquid-phase hydration (W) of isobutene (I) over an Amberlyst-15 catalyst. The system is normally a multiphase mixture of hydrocarbon, water, and solid catalysts. However, the use of cosolvents or excess TBA can achieve reasonable miscibility.
![]()
![]()
![]()
![]()
Derive a rate law assuming:
a. The surface reaction is rate-limiting.
b. The adsorption of isobutene is limiting.
c. The reaction follows Eley–Rideal kinetics
P10-4.5
![]()
and the surface reaction is limiting.
d. Isobutene (I) and water (W) are adsorbed on different sites.
P10-4.6
![]()
P10-4.7
![]()
TBA is not on the surface, and the surface reaction is rate-limiting.
![]()
e. What generalization can you make by comparing the rate laws derived in parts (a) through (d)?
The rate law for the hydrogenation (H) of ethylene (E) to form ethane (A) over a cobalt-molybdenum catalyst [Collection Czech. Chem. Commun., 51, 2760 (1988)] is
![]()
a. Suggest a mechanism and rate-limiting step consistent with the rate law.
b. What was the most difficult part in finding the mechanism?
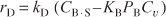
The formation of propanol on a catalytic surface is believed to proceed by the following mechanism

Suggest a rate-limiting step and derive a rate law.
The dehydration of n-butyl alcohol (butanol) over an alumina-silica catalyst was investigated by J. F. Maurer (Ph.D. thesis, University of Michigan). The data in Figure P10-7B were obtained at 750°F in a modified differential reactor. The feed consisted of pure butanol.
a. Suggest a mechanism and rate-controlling step that are consistent with the experimental data.
b. Evaluate the rate law parameters.
c. At the point where the initial rate is a maximum, what is the fraction of vacant sites? What is the fraction of occupied sites by both A and B?
d. What generalizations can you make from studying this problem?
e. Write a question that requires critical thinking and then explain why your question requires critical thinking. [Hint: See Preface Section B.2.]
f. Apply one or more of the six ideas in Table P-3, page xiii to this problem.
Figure . Figure P10-7B Initial reaction rate as function of initial partial pressure of butanol.

The catalytic dehydration of methanol (ME) to form dimethyl ether (DME) and water was carried out over an ion exchange catalyst [K. Klusacek, Collection Czech. Chem. Commun., 49, 170(1984)]. The packed bed was initially filled with nitrogen, and at t = 0 a feed of pure methanol vapor entered the reactor at 413 K, 100 kPa, and 0.2 cm3/s. The following partial pressures were recorded at the exit to the differential reactor containing 1.0 g of catalyst in 4.5 cm3 of reactor volume.

Suggest a mechanism, rate-limiting step, and rate law consistent with this data.
In 1981 the U.S. government put forth the following plan for automobile manufacturers to reduce emissions from automobiles over the next few years.

All values are in grams per mile. An automobile emitting 3.74 lbm of CO and 0.37 lbm of NO on a journey of 1000 miles would meet the current government requirements.

To remove oxides of nitrogen (assumed to be NO) from automobile exhaust, a scheme has been proposed that uses unburned carbon monoxide (CO) in the exhaust to reduce the NO over a solid catalyst, according to the reaction
![]()
Experimental data for a particular solid catalyst indicate that the reaction rate can be well represented over a large range of temperatures by
![]()

a. Propose an adsorption-surface reaction-desorption mechanism and rate-limiting step that are consistent with the experimentally observed rate law. Do you need to assume any species are weakly adsorbed to get agreement with Equation (P10-9.1)?
b. A certain engineer thinks that it would be desirable to operate with a very large stoichiometric excess of CO to minimize catalytic reactor volume. Do you agree or disagree? Explain.
Methyl ethyl ketone (MEK) is an important industrial solvent that can be produced from the dehydrogenation of butan-2-ol (Bu) over a zinc oxide catalyst [Ind. Eng. Chem. Res., 27, 2050 (1988)]:
![]()
The following data giving the reaction rate for MEK were obtained in a differential reactor at 490°C.

a. Suggest a rate law consistent with the experimental data.
b. Suggest a reaction mechanism and rate-limiting step consistent with the rate law. [Hint: Some species might be weakly adsorbed.]
c. Apply one or more of the six ideas in Table P-3, page xiii to this problem.
d. Plot conversion (up to 90%) and reaction rate as a function of catalyst weight for an entering molar flow rate of pure butan-2-ol of 10 mol/min at an entering pressure P0 = 10 atm. Wmax = 23 kg.
e. Write a question that requires critical thinking and then explain why your question requires critical thinking. [Hint: See Preface Section B.2.]
f. Repeat part (d), accounting for pressure drop and α = 0.03 kg–1. Plot y and X as a function of catalyst weight down the reactor.
Cyclohexanol was passed over a catalyst to form water and cyclohexene:
![]()
It is suspected that the reaction may involve a dual-site mechanism, but it is not known for certain. It is believed that the adsorption equilibrium constant for cyclohexanol is around 1.0 and is roughly one or two orders of magnitude greater than the adsorption equilibrium constants for the other compounds. Using these data:
Table P10-11B Data for Catalytic Formation of Cyclohexene

a. Suggest a rate law and mechanism consistent with the data given here.
b. Determine the values of the rate law parameters. [Ind. Eng. Chem. Res., 32, 2626–2632.]
c. Why do you think estimates of the rate law parameters were given?
d. For an entering molar flow rate of cychlohexanol of 10 mol/s at a partial pressure of 15 atm, what catalyst weight is necessary to achieve 85% conversion when the bulk density is 1500 gm/dm3?
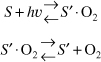
Solar Energy Capture: Water Splitting. Hydrogen and O2 can be combined in fuel cells to generate electricity. Solar energy can be used to split water to generate the raw reactant H2 and O2 for fuel cells. One method of solar thermal reduction is with NiFe2O4 in the sequence

We note NiFe2O4 is regenerated in this process.21
a. Derive a rate law for Step (2), assuming that water adsorbs on the solid solution as a single-site mechanism and that the reaction is irreversible.
b. Repeat (a) when the reaction is reversible and the solid solution adsorption site for water (S′) is different than the NiFe2O4 site for the adsorption of H2, (S).

c. How would your rate law change if we included Step 1?
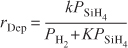
A recent study of the chemical vapor deposition of silica from silane (SiH4) is believed to proceed by the following irreversible two-step mechanism [J. Electrochem. Soc., 139(9), 2659 (1992)]:
![]()
![]()
This mechanism is somewhat different, in that while SiH2 is irreversibly adsorbed, it is highly reactive. In fact, adsorbed SiH2 reacts as fast as it is formed [i.e., ![]() , i.e., PSSH (Chapter 9)], so that it can be assumed to behave as an active intermediate.
, i.e., PSSH (Chapter 9)], so that it can be assumed to behave as an active intermediate.
a. Determine if this mechanism is consistent with the following data:
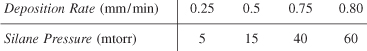
b. At what partial pressures of silane would you take the next two data points?
Vanadium oxides are of interest for various sensor applications, owing to the sharp metal–insulator transitions they undergo as a function of temperature, pressure, or stress. Vanadium triisopropoxide (VTIPO) was used to grow vanadium oxide films by chemical vapor deposition [J. Electrochem. Soc., 136, 897 (1989)]. The deposition rate as a function of VTIPO pressure for two different temperatures follows:
T = 120°C:
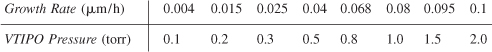
T = 200°C:

In light of the material presented in this chapter, analyze the data and describe your results. Specify where additional data should be taken.
Titanium dioxide is a wide-bandgap semiconductor that is showing promise as an insulating dielectric in VLSI capacitors and for use in solar cells. Thin films of TiO2 are to be prepared by chemical vapor deposition from gaseous titanium tetraisopropoxide (TTIP). The overall reaction is
![]()
The reaction mechanism in a CVD reactor is believed to be [K. L. Siefering and G. L. Griffin, J. Electrochem. Soc., 137, 814 (1990)]

where I is an active intermediate and P1 is one set of reaction products (e.g., H2O, C3H6) and P2 is another set. Assuming the homogeneous gas-phase reaction for TTIP is in equilibrium, derive a rate law for the deposition of TiO2. The experimental results show that at 200°C the reaction is second order at low partial pressures of TTIP and zero order at high partial pressures, while at 300°C the reaction is second order in TTIP over the entire pressure range. Discuss these results in light of the rate law you derived.
The dehydrogenation of methylcyclohexane (M) to produce toluene (T) was carried out over a 0.3% Pt/Al2O3 catalyst in a differential catalytic reactor. The reaction is carried out in the presence of hydrogen (H2) to avoid coking [J. Phys. Chem., 64, 1559 (1960)].
a. Determine the model parameters for each of the following rate laws.
Use the data in Table P10-16B below.
b. Which rate law best describes the data? (Hint: Neither KH2 or KM can take on negative values.)
c. Where would you place additional data points?
d. Suggest a mechanism and rate-limiting step consistent with the rate law you have chosen.
Table P10-16B Dehydrogenation of Methylcyclohexane


• Additional Homework Problems similar to the examples below can be found on the DVD-ROM.
CD10GA-1
Suggest a rate law and mechanism for the catalytic oxidation of ethanol over tantalum oxide when adsorption of ethanol and oxygen take place on different sites. [2nd ed. P6-17]
CD10GA-2
Titanium films are used in decorative coatings as well as wear-resistant tools because of their thermal stability and low electrical resistivity. TiN is produced by CVD from a mixture of TiCl4 and NH3TiN. Develop a rate law, mechanism, and rate-limiting step and evaluate the rate law parameters.
Supplementary Reading
- A terrific discussion of heterogeneous catalytic mechanisms and rate-controlling steps may be found in
MASEL, R. I., Principles of Adsorption and Reaction on Solid Surfaces. New York: Wiley, 1996.
SOMORJAI, G. A., Introduction to Surface Chemistry and Catalysis. New York: Wiley, 1994.
- A truly excellent discussion of the types and rates of adsorption together with techniques used in measuring catalytic surface areas is presented in
MASEL, R. I., Principles of Adsorption and Reaction on Solid Surfaces. New York: Wiley, 1996.
- Techniques for discriminating between mechanisms and models can be found in
BOX, G. E. P., W. G. HUNTER, and J. S. HUNTER, Statistics for Experimenters. New York: Wiley, 1978.
- Examples of applications of catalytic principles to microelectronic manufacturing can be found in
BURGESS, THORNTON W., The Adventures of Grandfather Frog. New York: Dover Publications, Inc., 1915.
BUTT, JOHN B, Reaction Kinetics and Reactor Design. Second Edition, Revised and Expanded. New York: Marcel Dekker, Inc., 1999.
DOBKIN, D. M., and M. K. ZURAW. Principles of Chemical Vapor Deposition. The Netherlands: Kluwer Academic Publishers, 2003.