11.10 EFFECT OF PROJECTION OPERATION ON DATA
Now that we know both the projection and scheduling functions, we are able to study how the input and output variables map to the projected domain ![]() .
.
11.10.1 Output Data M1
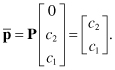
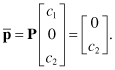
The pipeline direction for the output data is mapped to the vector ![]() given by
given by
(11.108)
![]()
Therefore, the output data will map to pipelining arrows along the k-axis (vertical lines) in the resulting multiprocessor architecture shown in Fig. 11.6.
The initialization and extraction points for the output data are found in Eq. 11.51. The initialization point for input M1(c1, c2) map in ![]() to the point
to the point ![]() .
.
(11.109)
Similarly, the extraction point for input M1(c1, c2) map in ![]() to the point
to the point ![]() .
.
(11.110)
11.10.2 Input Data M2
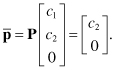
The broadcast direction for input data is mapped to the vector ![]() given by
given by
(11.111)
![]()
Figure 11.6 The projected or reduced computation domain ![]() for the matrix multiplication algorithm when the dimensions of the matrices are I = 3, J = 4, and K = 5.
for the matrix multiplication algorithm when the dimensions of the matrices are I = 3, J = 4, and K = 5.
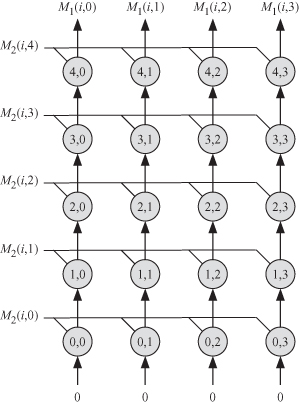
Therefore, the input data for M2 will map to lines along the j-axis (horizontal lines) in the resulting multiprocessor architecture shown in Fig. 11.6.
The input sample M2(c1, c2) is fed to our multiprocessor using its intersection point from Eq. 11.43.
(11.112)
11.10.3 Input Data M3
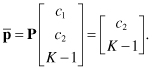
The broadcast direction for the input data is mapped to the vector ![]() given by
given by
(11.113)
![]()
This means that the input M3 is localized and is neither pipelined nor broadcast.
The input sample M3(c1, c2) is fed to our multiprocessor using its intersection point from Eq. 11.47.
(11.114)