14.10 INTERPOLATOR DEPENDENCE GRAPH
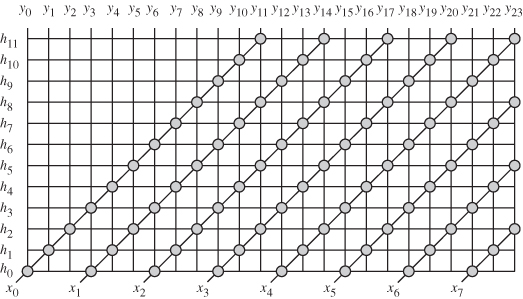
The author and his group provided a z-transform technique for obtaining several decimator structures [96–98]. However, for the case of multirate systems, this approach was not able to provide the rich set of design space exploration that the dependence graph approach could provide. Fig. 14.11 shows the dependence graph of the interpolator. The horizontal axis is the n-axis and vertical axis is the k-axis. The figure shows the dependence graph of the filter whose input samples are u(nL). At the top of the figure, we indicate the interpolator output y(n). In order to conserve space, we used subscripts in the figure to indicate index values for the different samples. The gray circles correspond to the samples x(n) and the empty circles correspond to the stuffed zero-valued samples. In a sense, this is wasted operations. Figure 14.12 shows the dependence graph of the interpolator where only the useful operations and outputs are indicated. This figure is a bit less cluttered compared to Fig. 14.11. We removed the empty circles and only retained the shaded circles that give the desired outputs.
Figure 14.11 General 1-to-L interpolator dependence graph for the case when L = 3 and N = 12.
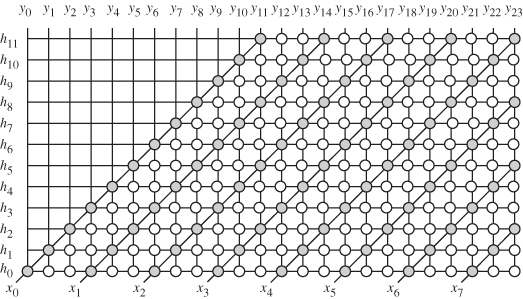
Figure 14.12 1-to-L interpolator dependence graph for the case when L = 3 and N = 12. Unnecessary operations and output samples have been removed from the figure.