
15.3 OBTAINING THE ALGORITHM DEPENDENCE GRAPH
The string matching algorithm of Eq. 15.1 is defined on a two-dimensional (2-D) domain since there are two indices (i, j). Therefore, a data dependence graph can be easily drawn as shown in Fig. 15.1. The computation domain is the convex hull in the 2-D space where the algorithm operations are defined as indicated by the grayed circles in the 2-D plane [86]. The output variable y is represented by vertical lines so that each vertical line corresponds to a particular instance of y. For instance, the line described by the equation i = 3 represents the output variable instance y3. The input variable t is represented by the slanted lines. Again, as an example, the line represented by the equation
(15.2)
![]()
Figure 15.1 Dependence graph for m = 4 and n = 10.
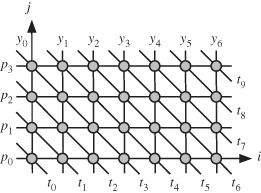
represents the input variable instance t3. Similarly, the input variable p is represented by the horizontal lines.