CHAPTER 9
Bond Markets
Aims
- To explain spot rates (yields) and the ‘yield to maturity’ on a bond.
- To show that the ‘fair’ price of a coupon paying bond is determined by spot yields – otherwise risk-free arbitrage profits can be made by a strategy known as coupon stripping.
- To show how the yield to maturity is ‘derived’ from the market price of the bond.
There are a wide variety of different types of bonds. A conventional government bond usually pays to the holder a fixed amount of cash (‘the coupon’) every 6 months plus the maturity (redemption, par, or principal) value at the end of the bond's life. However, not all bonds have fixed coupons or fixed maturity dates. For example, some corporate bonds can be redeemed (or ‘called’) prior to their maturity date while other corporate bonds (i.e. convertible bonds) can be exchanged for common stock (equity) of the issuer, at some future date. So convertibles have a ‘mixture’ of payments in terms of coupons and then dividends if converted into equity.
Bonds are usually issued to obtain long term finance – the initial maturities are from 1 year to 30 years (with some being non-redeemable and known as perpetuities). They are issued by governments, and their agencies (e.g. Municipal Securities in the US and Local Authority Bonds in the UK) and by the corporate sector. They may be denominated in the home currency of the issuer or in a foreign currency (e.g. a UK corporate issuing dollar denominated bonds). A key difference between government issued bonds and those issued by corporates, is default risk. Generally speaking government bonds denominated in the home currency are described as ‘risk-free’, meaning there is no default risk. This is because governments usually have the legal right to raise taxes or to print their own currency, in order to pay the interest and principal on the bonds. But even Government bonds issued by the US government are not entirely free of default risk – but we assume such risk is very low. However, Greek bonds issued in 2010 and denominated in euros were not perceived as being risk-free. This is because holders of Greek bonds might not believe that the Greek government has the (de facto) democratic legitimacy and ability to raise enough euros from taxes to pay the interest and principal – and the Greek government cannot ‘print’ euros (only the European Central Bank can). Hence Greek government bonds issued in the years after 2010 are subject to a high probability of default. Also, zero default risk would not necessarily be true for government bonds denominated in a foreign currency – as was the case for countries like Mexico and Argentina, who effectively defaulted on dollar interest payments on their dollar denominated bonds.
In this chapter we discuss ‘risk-free’ government bonds, which provide the main analytic concepts for the reader to study other types of bonds mentioned above and how bond portfolios are hedged using futures and options.
9.1 PRICES, YIELDS, AND RETURN
We begin with an analysis of the relationship between bond prices, spot yields and the yield to maturity. After discussing ‘zero-coupon bonds’, we demonstrate how we can use risk-free arbitrage to price a coupon paying bond by considering it as a series of zero-coupon bonds. This allows a consistent methodology for the pricing of bonds.
9.1.1 Pure Discount/Zero-coupon Bonds
Bonds which have a single payout, but have a maturity greater than 1 year, are usually classified as pure discount bonds or zero-coupon bonds. Suppose a pure discount bond has a single payout ![]() (dollar) in
(dollar) in ![]() years' time. If we know
years' time. If we know ![]() ,
, ![]() and the observed market price
and the observed market price ![]() then we can calculate the current (compound) spot rate (yield),
then we can calculate the current (compound) spot rate (yield), ![]() , using:
, using:
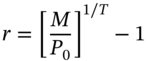
Hence:

Example 9.1 calculates the spot rate (yield) for a zero-coupon bond with maturity of 6 years.
Taking logarithms of (9.1b) and using the approximation ![]() we obtain
we obtain ![]() and differentiating (with respect to
and differentiating (with respect to ![]() ) we obtain:
) we obtain:

For a zero-coupon bond, the time to maturity (in years) is also the ‘duration’ of the bond. The proportionate (percentage) change in the bond price is usually referred to as the (holding period) ‘return on the bond’.1
For example, for a two-year zero-coupon bond (![]() ), Equation (9.2) implies that when the spot yield increases from 2% to 2.1% p.a. over 1 week (say), then the percentage change in the bond price (over 1 week) will be a fall of around 0.2%. Hence, if the initial price of the bond is
), Equation (9.2) implies that when the spot yield increases from 2% to 2.1% p.a. over 1 week (say), then the percentage change in the bond price (over 1 week) will be a fall of around 0.2%. Hence, if the initial price of the bond is ![]() , the price in 1 week's time would be (close to) $98.8.
, the price in 1 week's time would be (close to) $98.8.
If we have lots of ‘zeros’ of different maturities then we can observe their current market prices and calculate spot rates for 1 year, 2 year, 3 years, etc. For example, (compound) spot rates at 10 a.m. today might be 5, 5.12, 5.23, … 5.51, 5.52, 5.52, 5.52, … for years 1, 2, 3, …, 15, 16, 17, 18, …, respectively. If we plot a simple graph of the spot rates against time to maturity, then this is known as the (spot) yield curve (at 10 a.m. today) – here the yield curve is upward sloping and then flattens out for maturities longer than 16 years.
What these spot rates imply is that if you want to borrow, say, $1,000 today and pay back all the interest and principal in exactly 16 years' time, then you will end up owing ![]() . Alternatively, if the maturity value of a 16-year zero-coupon bond is
. Alternatively, if the maturity value of a 16-year zero-coupon bond is ![]() = $2,362.42, and the 16-year spot yield is 5.52%, then the market price of the bond today is
= $2,362.42, and the 16-year spot yield is 5.52%, then the market price of the bond today is ![]() . So the 16-year spot rate is the cost of borrowing money today, with one single repayment in exactly 16 years' time. As our yield curve is currently upward sloping, it costs more to borrow money the longer the time horizon over which you wish to borrow. Apart from the bid–ask spread (which we ignore), then the cost of lending money today, with one repayment in 1 year's time is 5% p.a., and with one repayment in 2 years it is 5.12% p.a., etc.
. So the 16-year spot rate is the cost of borrowing money today, with one single repayment in exactly 16 years' time. As our yield curve is currently upward sloping, it costs more to borrow money the longer the time horizon over which you wish to borrow. Apart from the bid–ask spread (which we ignore), then the cost of lending money today, with one repayment in 1 year's time is 5% p.a., and with one repayment in 2 years it is 5.12% p.a., etc.
The price of zeros is determined by the supply of bonds (i.e. borrowers of money) and the demand for bonds (i.e. lenders of money). Usually, governments are borrowers of money and issue bonds while pension funds, insurance companies, and (older) individuals are lenders of money and they purchase bonds. The price of a ‘zero’ will change today, when the balance of supply and demand in the market for funds (for a particular maturity date), changes. But note that it is always true of fixed-income assets like bonds that the bond price and (spot) yields always move in opposite directions.
Generally speaking interest rates of all maturities tend to move up and down together. For example, if at 3 p.m. all spot rates are higher by 0.1%, say, this would be called a ‘parallel shift’ in the yield curve. Analytically, spot yields are the ‘building blocks’ for analysing fixed-income assets such as coupon-paying bonds, and other fixed income derivatives such as swaps, caps, and floors.
9.1.2 Coupon Paying Bonds
Coupon paying bonds provide a known stream of cash flows called coupons, C, payable each year (say) over the remaining life of the bond. Most bonds have a known final payment at maturity known as the ‘par value’, the ‘principal value’ or ‘maturity value’, ![]() (Figure 9.1). There are some bonds which although they pay coupons, are never redeemed and these are known as perpetuities (e.g. ‘3% Consols’ issued by the UK government).
(Figure 9.1). There are some bonds which although they pay coupons, are never redeemed and these are known as perpetuities (e.g. ‘3% Consols’ issued by the UK government).

FIGURE 9.1 Coupon paying bond
Bond prices quoted in the financial press and on electronic trading screens are known as ‘clean prices’. The pricing formulas below all refer to the clean price. However, the actual price paid by an investor is known as the ‘invoice price’ and includes accrued or ‘rebate’ interest (see Cuthbertson and Nitzsche 2008).
9.1.3 Coupon-yield (Interest-yield, Flat-yield, ‘Current-yield’ in USA)
The ‘coupon-yield’ on a bond is usually quoted in the financial press and is calculated as:

The ‘coupon-yield’ is a very poor measure of the return on a bond since:
- it ignores any capital gains which occur if the bond is purchased at a price below its maturity value,
 ;
; - it ignores ‘interest-on-interest’ from coupon payments.
9.1.4 Yield to Maturity (Redemption Yield)
Knowing the market price ![]() , the coupon
, the coupon ![]() (here paid annually) the maturity value
(here paid annually) the maturity value ![]() , and the number of years to maturity,
, and the number of years to maturity, ![]() then the yield to maturity (YTM),
then the yield to maturity (YTM), ![]() , is the solution to:
, is the solution to:

It can be shown (using the annuity formula) that this simplifies to:

where the ‘annuity value’ is defined as: 
The ‘annuity value’ is the present value of $1 paid at the end of each year, for ![]() years using the YTM as the discount rate. The YTM is the rate
years using the YTM as the discount rate. The YTM is the rate ![]() which equates the present value of future cash flows
which equates the present value of future cash flows ![]() and the maturity value
and the maturity value ![]() , with the current market price. Hence, the YTM is the ‘internal rate of return’ (IRR) of the bond. Here
, with the current market price. Hence, the YTM is the ‘internal rate of return’ (IRR) of the bond. Here ![]() ,
, ![]()
![]() and
and ![]() are known and we (or the Financial Times/Wall Street Journal) calculate
are known and we (or the Financial Times/Wall Street Journal) calculate ![]() using Excel's ‘IRR’ inbuilt command.
using Excel's ‘IRR’ inbuilt command.
If coupon payments are annual then ![]() … refers to years and
… refers to years and ![]() is an annual (compound) rate. However, for government bonds the coupons are usually paid semi-annually and in this case we replace
is an annual (compound) rate. However, for government bonds the coupons are usually paid semi-annually and in this case we replace ![]() in the above formula by
in the above formula by ![]() and
and ![]() is replaced by the semi-annual coupon payments
is replaced by the semi-annual coupon payments ![]() (and
(and ![]() for 6 months,
for 6 months, ![]() for 1 year, etc.). It follows that
for 1 year, etc.). It follows that ![]() is the ‘semi-annual rate’, and
is the ‘semi-annual rate’, and ![]() is the quoted ‘simple’ annual rate (which in the US is known as ‘the bond equivalent yield’). If
is the quoted ‘simple’ annual rate (which in the US is known as ‘the bond equivalent yield’). If ![]() = the (unknown) 5-year YTM (p.a.), then a 5-year bond with semi-annual coupon payments (
= the (unknown) 5-year YTM (p.a.), then a 5-year bond with semi-annual coupon payments (![]() every 6 months), has a market price given by:
every 6 months), has a market price given by:

Knowing the market price of the bond and all the variables on the right-hand side of the above equation, we can calculate the YTM and a simple example is given in Example 9.2, where the YTM is 6% p.a.
The YTM is made up of three elements:
YTM = coupon rate + interest on the coupons + capital gain (or loss) from the difference between the purchase price P and the maturity value M.
The YTM measures the (annual compound) rate of return on the bond if (i) it is held to maturity and (ii) all the future coupon payments can be reinvested (when received) at a rate of interest equal to the (current) YTM. If these conditions do not hold, then the YTM will not correctly measure the ‘return’ on the bond even if it is held to maturity.
It is the assumption that the future coupon payments can be reinvested at the current YTM which creates problems, since we do not know today at what rate of interest we can reinvest these future payments. However, the YTM is the best single figure we can use to (approximately) represent the average annual percentage return on the bond if it is held to maturity. The YTM is widely used when discussing strategies amongst bond market traders and traders of derivatives whose prices depend on interest rates (yields).
The YTM can be calculated using the ‘clean price’ or the invoice price. For the UK when ![]() is the invoice price then
is the invoice price then ![]() is known as the gross redemption yield (and is published daily in the Financial Times). Note that the YTM does not determine (in an economic sense) the price of the bond – the YTM is derived from the observed market price of the bond. However, if someone has already calculated the YTM then Equation (9.4) can of course be used to calculate the bond price (see Example 9.3).
is known as the gross redemption yield (and is published daily in the Financial Times). Note that the YTM does not determine (in an economic sense) the price of the bond – the YTM is derived from the observed market price of the bond. However, if someone has already calculated the YTM then Equation (9.4) can of course be used to calculate the bond price (see Example 9.3).
It is clear from Equation (9.4) that the YTM and the market price of a bond are negatively related and the relationship is non-linear (‘convex’ – see Figure 9.2).

FIGURE 9.2 Bond price and yield
9.1.5 YTM and Coupon Rate
The coupon rate (or coupon yield) is defined as ![]() . There are some ‘rules of thumb’ used by traders when discussing the relationship between the YTM and the coupon rate of a bond. It is easy to show that if the coupon rate equals the YTM, then the bond is currently trading at a market price equal to its maturity (par) value. For example, consider a bond with a 10% (annual) coupon rate, which also has a YTM of 10% and the bond has 2 years to maturity and a par (maturity) value of
. There are some ‘rules of thumb’ used by traders when discussing the relationship between the YTM and the coupon rate of a bond. It is easy to show that if the coupon rate equals the YTM, then the bond is currently trading at a market price equal to its maturity (par) value. For example, consider a bond with a 10% (annual) coupon rate, which also has a YTM of 10% and the bond has 2 years to maturity and a par (maturity) value of ![]() . We can easily demonstrate that the market price of this bond equals its par value of £100. Using Equation (9.4):
. We can easily demonstrate that the market price of this bond equals its par value of £100. Using Equation (9.4):
If the coupon rate (![]() ) is below the YTM, then the market price
) is below the YTM, then the market price ![]() will be below the par value (of
will be below the par value (of ![]() = £100) and the bond currently sells ‘at a discount’. Conversely, if the coupon rate
= £100) and the bond currently sells ‘at a discount’. Conversely, if the coupon rate ![]() is above the YTM the bond will today have a market price above its par value of
is above the YTM the bond will today have a market price above its par value of ![]() – it will be trading at a ‘premium’. The qualitative relationship between the market price, coupon rate (
– it will be trading at a ‘premium’. The qualitative relationship between the market price, coupon rate (![]() ) and YTM is given in Table 9.1 and they can be deduced from the following rearrangement of Equation (9.4):
) and YTM is given in Table 9.1 and they can be deduced from the following rearrangement of Equation (9.4):

TABLE 9.1 Yield and price relationship
| Bond sells at | Relationship |
|
|
|
|
|
|
|
|
|
If the current YTM, ![]() , the coupon rate, then Equation (9.7) gives
, the coupon rate, then Equation (9.7) gives ![]() , that is the market price of the bond
, that is the market price of the bond ![]() , equals its maturity value
, equals its maturity value ![]() . Also, it follows that if (
. Also, it follows that if (![]() ) is less than
) is less than ![]() , then
, then ![]() and the current market price will be less than the bond's maturity value.
and the current market price will be less than the bond's maturity value.
9.2 PRICING COUPON BONDS
This section discusses why bonds are priced using spot rates. Bond prices that do not reflect prevailing spot rates can be subject to coupon stripping and risk-free arbitrage opportunities – which is the reason market participants use spot rates to price bonds. The spot rate ![]() is the (annual compound) rate of return on an investment that has a one-off payout in
is the (annual compound) rate of return on an investment that has a one-off payout in ![]() years' time. It is the return (yield) on a zero-coupon bond.
years' time. It is the return (yield) on a zero-coupon bond.

If there were zero-coupon bonds for all maturities then we could observe their prices ![]() , etc. and use Equation (9.8) to calculate
, etc. and use Equation (9.8) to calculate ![]() (for
(for ![]() ). These spot rates would be the outcome of the demand and supply of zero-coupon bonds in the market. Any (non-callable) coupon bond can be viewed as a ‘bundle’ of zero-coupon bonds. Hence, the price of a coupon bond should equal the PV of the future coupon payments, where each coupon payment is discounted at the appropriate spot rate:
). These spot rates would be the outcome of the demand and supply of zero-coupon bonds in the market. Any (non-callable) coupon bond can be viewed as a ‘bundle’ of zero-coupon bonds. Hence, the price of a coupon bond should equal the PV of the future coupon payments, where each coupon payment is discounted at the appropriate spot rate:

Each ![]() may be viewed as a one-off payment at times
may be viewed as a one-off payment at times ![]() (and for most bonds
(and for most bonds ![]() , a constant). The maturity (redemption) value
, a constant). The maturity (redemption) value ![]() is a one-off payment at time,
is a one-off payment at time, ![]() . Each separate coupon (and
. Each separate coupon (and ![]() ) may be considered as a strip of zero-coupon bonds, discounted at the spot rate applicable to payments at
) may be considered as a strip of zero-coupon bonds, discounted at the spot rate applicable to payments at ![]() . Spot rates are the correct way to price government bonds, since all coupons at time
. Spot rates are the correct way to price government bonds, since all coupons at time ![]() on different bonds are discounted at the same spot rate
on different bonds are discounted at the same spot rate ![]() . Once we have the spot rates, the price of a coupon paying bond is easy to calculate as shown in Example 9.4.
. Once we have the spot rates, the price of a coupon paying bond is easy to calculate as shown in Example 9.4.
9.2.1 Calculation of Spot Rates
We now turn to the problem of estimating spot rates when they are not directly observed in the market. In the US and the UK, T-bills which are risk-free pure discount bonds are only issued with maturities up to 1 year. In general, government bonds with maturities greater than 1 year are issued as coupon paying bonds. However, spot yields can be calculated from coupon-paying bonds in several ways and here we demonstrate the method known as bootstrapping. Example 9.5 considers the case where we can directly observe the 6-month and 12-month spot yields (![]() and
and ![]() ) on zero-coupon bonds but not the 18-month spot yield
) on zero-coupon bonds but not the 18-month spot yield ![]() , since we assume there are no zero-coupon bonds with maturities longer than 1 year. However, the 18-month spot yield
, since we assume there are no zero-coupon bonds with maturities longer than 1 year. However, the 18-month spot yield ![]() can be derived using the observed market price of a coupon paying bond with 18 months to maturity. As we see in later chapters, spot rates can also be calculated from observed Eurodollar futures prices and their implied forward rates and from observed swap rates.
can be derived using the observed market price of a coupon paying bond with 18 months to maturity. As we see in later chapters, spot rates can also be calculated from observed Eurodollar futures prices and their implied forward rates and from observed swap rates.
Similarly, if we have coupon paying bonds for 2 years, 2.5 years, etc. then the bootstrapping procedure can be repeated to calculate spot rates for these years. In this way we can obtain the complete spot yield curve. Where a coupon paying bond does not exist for a particular maturity (e.g. for maturity of 7.5 years) then the spot rate can be derived as an interpolation of the (derived) 7-year and 8-year spot yields. In fact, it is a little more subtle than this since after deriving the spot yields for those years for which we have coupon paying bonds, a smooth curve is fitted to be ‘close to’ all these observed data points – using rather sophisticated techniques (e.g. cubic splines).
9.2.2 Coupon Stripping
Zero-coupon T-bonds can be created by dealer firms, by selling off the ‘ownership’ of the coupon payments from coupon paying bonds. However, observed interest rates on ‘stripped’ Treasuries can give a misleading measure of risk-free spot rates because (i) strips are less liquid/marketable, hence their yields reflect a liquidity premium and (ii) there is preferential tax treatment for some holders of strips (e.g. some overseas purchasers) and this ‘tax effect’ is reflected in observed yields. Even though spot rates are observable in the strips market, it may still be necessary to use ‘bootstrap procedures’ or ‘curve fitting’ to obtain good estimates of the true risk-free spot rates.
We now demonstrate why coupon paying bonds should be priced using spot rates. This occurs because if coupon bonds are not priced using spot rates, then there is a potential (risk-free) arbitrage profit to be made from ‘coupon stripping’ the bond.
Example 9.6 shows that the ‘fair price’ of a 2-year coupon paying bond, calculated using current spot rates is ![]() . Suppose a dealer has not used spot rates to price the bond and is quoting a price of
. Suppose a dealer has not used spot rates to price the bond and is quoting a price of ![]() – the bond is underpriced. You can make an arbitrage profit by ‘buying low and selling high’. You purchase the bond for $970 from the dealer and simultaneously offer to sell the first coupon payment of $40 to a pension fund and the second payment of $1,040 to an insurance company. Given current spot-rates, the pension fund will be willing to pay you $38.0952 today to secure the receipt of $40 in 1 year's time. Similarly the insurance company will be willing to pay you $934.3905 today, to secure the receipt of $1,040 in 2 years' time. So today you receive a total of $972.4858 from the pension fund and insurance company and you use this to purchase the 2-year coupon bond at
– the bond is underpriced. You can make an arbitrage profit by ‘buying low and selling high’. You purchase the bond for $970 from the dealer and simultaneously offer to sell the first coupon payment of $40 to a pension fund and the second payment of $1,040 to an insurance company. Given current spot-rates, the pension fund will be willing to pay you $38.0952 today to secure the receipt of $40 in 1 year's time. Similarly the insurance company will be willing to pay you $934.3905 today, to secure the receipt of $1,040 in 2 years' time. So today you receive a total of $972.4858 from the pension fund and insurance company and you use this to purchase the 2-year coupon bond at ![]() , making a risk-free profit of $2.4858 today. We assume that your trades do not affect current prices (or current spot yields).
, making a risk-free profit of $2.4858 today. We assume that your trades do not affect current prices (or current spot yields).
However, there are lots of arbitrageurs around to take advantage of this mispricing. So, many arbitrageurs buy the 2-year coupon bond, which will tend to increase its price. Also, by selling one-year and two-year strips, their prices fall (or equivalently their spot yields rise). Arbitrage will continue until the market price of the 2-year coupon bond equals the PV of the sum of the receipts from coupon stripping – that is, until the market price of the coupon bond equals its fair value. Since arbitrage here involves a near risk-free transaction – the market price of the bond will quickly reflect its fair value. Our key result is therefore:
The quoted price of a coupon bond is determined by the current term structure of spot rates. The YTM is then derived from the quoted price.
9.3 SUMMARY
- Spot rates (yields) refer to the cost of lending (or borrowing) money today, with the principal and interest payable at one specific time in the future.
- The YTM is an approximate measure of the annual return on a T-bond if it is held to maturity and all the future coupons are reinvested (at the current YTM). Hence, the YTM depends on (i) the coupon payments
 , (ii) any interest-on-interest on the reinvested coupons, (iii) the maturity value
  , (iv) the time to maturity of the bond, and (v) any capital gain (or loss) from the difference between the purchase price
  and the maturity value
  .
. - The ‘fair’ (‘no-arbitrage’) price of a coupon paying bond is determined by current spot yields – otherwise risk-free arbitrage profits can be made by a strategy known as coupon stripping. Once we have calculated the ‘fair’ price using current spot yields we can then infer the current YTM that is consistent with this price.
- The market price of a bond and the yield to maturity YTM are inversely related.
EXERCISES
Question 1
What is a Treasury ‘strip’?
Question 2
What are the key features of a coupon paying bond that determines its yield to maturity? What are the strengths and defects of the yield to maturity as a measure of the return on the bond if held to maturity?
Question 3
Assume that you require a 10% (compound) return on a 5-year zero-coupon bond with a par (maturity) value of £1,000. What price would you pay for the bond today?
Question 4
Consider a 7%-coupon US government bond that has a par value of $1,000 and matures 5 years from now. The coupon payments are annual. The current yield to maturity (YTM) for such bonds is 8% p.a. (compound rate). Calculate the market price of the bond and state whether you expect this bond to sell at par, at a premium (over par), or at a discount.
Question 5
Why are coupon paying bonds priced using spot yields? What then is the significance of the yield to maturity (YTM)?
Question 6
Quoted (compound) spot rates (yields) are as follows:
| Year, |
Spot rate, % p.a. |
| 1 | |
| 2 | |
| 3 | |
| 4 | |
| 5 |
- What are the discount factors for each year – that is, the value today of $1 received in year
 ?
? - Calculate the present value PV and hence the fair price of the following Treasury notes/bonds with annual coupons, all of which have
 par value.
- 5% coupon, 2-year note
- 5% coupon, 5-year note
- 10% coupon, 5-year note
- What are the one year (compound) forward rates applicable between (i) year-1 and year-2, (ii) year-2 and year-3?