
Data Assumptions and Alternatives when Comparing Categories
Introduction to Data Assumptions
When considering comparison of categories, some (but not all) traditional parametric
statistics rely on certain assumptions, including but not limited to:
-
Normality: Many statistical tests assume normality of various things, including:
-
The statistical estimates under review.
-
In some cases only the actual data itself should be normal. For instance, to use traditional tests to compare the productivity of two factories, the productivity data of each factory needs to be normally distributed. This is a troublesome assumption, as many datasets are not normal in distribution.
-
Residuals: In some of the techniques, the data doesn’t need to be normally distributed but the residuals (misses) preferably do need to be normal, as in regression.
-
-
Equal variances: In addition, traditional methods generally assume that the variance (standard deviation squared) of the data in each group is approximately equal. (In the example above, the assumption is that the variance of data for each factory is equal.) This is not necessarily a troublesome assumption, as adapted statistics have been developed for unequal variances. However, it still needs to be considered.
The term parametric refers to a statistical test that needs these types of assumptions to be true.
It is predominantly the accuracy statistics (p-values and confidence intervals) that
are affected by these assumptions. This issue is more of a problem in comparison of
categories than in regression, for reasons explained later. Most comparison of categories
tests are robust to mild violations of these assumptions, which means that the violations
do not affect the findings too badly. However, when assumptions are heavily violated,
the researcher should take some remedial action. There are four major approaches to
dealing with data that does not follow the assumptions, as discussed next.
Transforming the Dependent Variable
Transforming the dependent variable sometimes achieves normality or equality of variances.
For example skew distributions can often be fixed by using the log or square root
of the dependent variable.
Of course, if you transform the dependent variable, the numerical properties do take
on different meanings. You would have to read further to understand some of the results.
Alternative Parametric Statistics
Some alternative parametric statistics have been developed that can compare means without all the assumptions
above (the alternate Satterthwaite t-test for unequal variances is an example). However,
these also come with their own assumption requirements, which must also be met.
Bootstrapping
Bootstrapping, as introduced in Chapter 12 and used previously in the regression chapters, gives
accuracy statistics (generally, confidence intervals) that are robust to assumption
violations. As with regression I advocate bootstrapping as standard in most cases,
except when your samples are very small.
Nonparametric Statistics
Nonparametric statistics are alternative approaches that do not require most or any of the assumptions. They
are desirable in situations where your data has distribution issues, or where your
data is not continuous in the first place (e.g. if your data is fundamentally ordinal
in nature).
Nonparametric approaches cease to worry about the underlying measurement metric of
the dependent variable. Instead, most (but not all) nonparametric tests usually simply
calculate the relative rank that each observation’s dependent variable score has in the context of the other
variables. For instance, in Figure 14.2 Ranking of dependent variable for nonparametric comparison I give a ranking of 10 sales scores, where “1” means the highest sales levels in
the group.
Figure 14.2 Ranking of dependent variable for nonparametric comparison
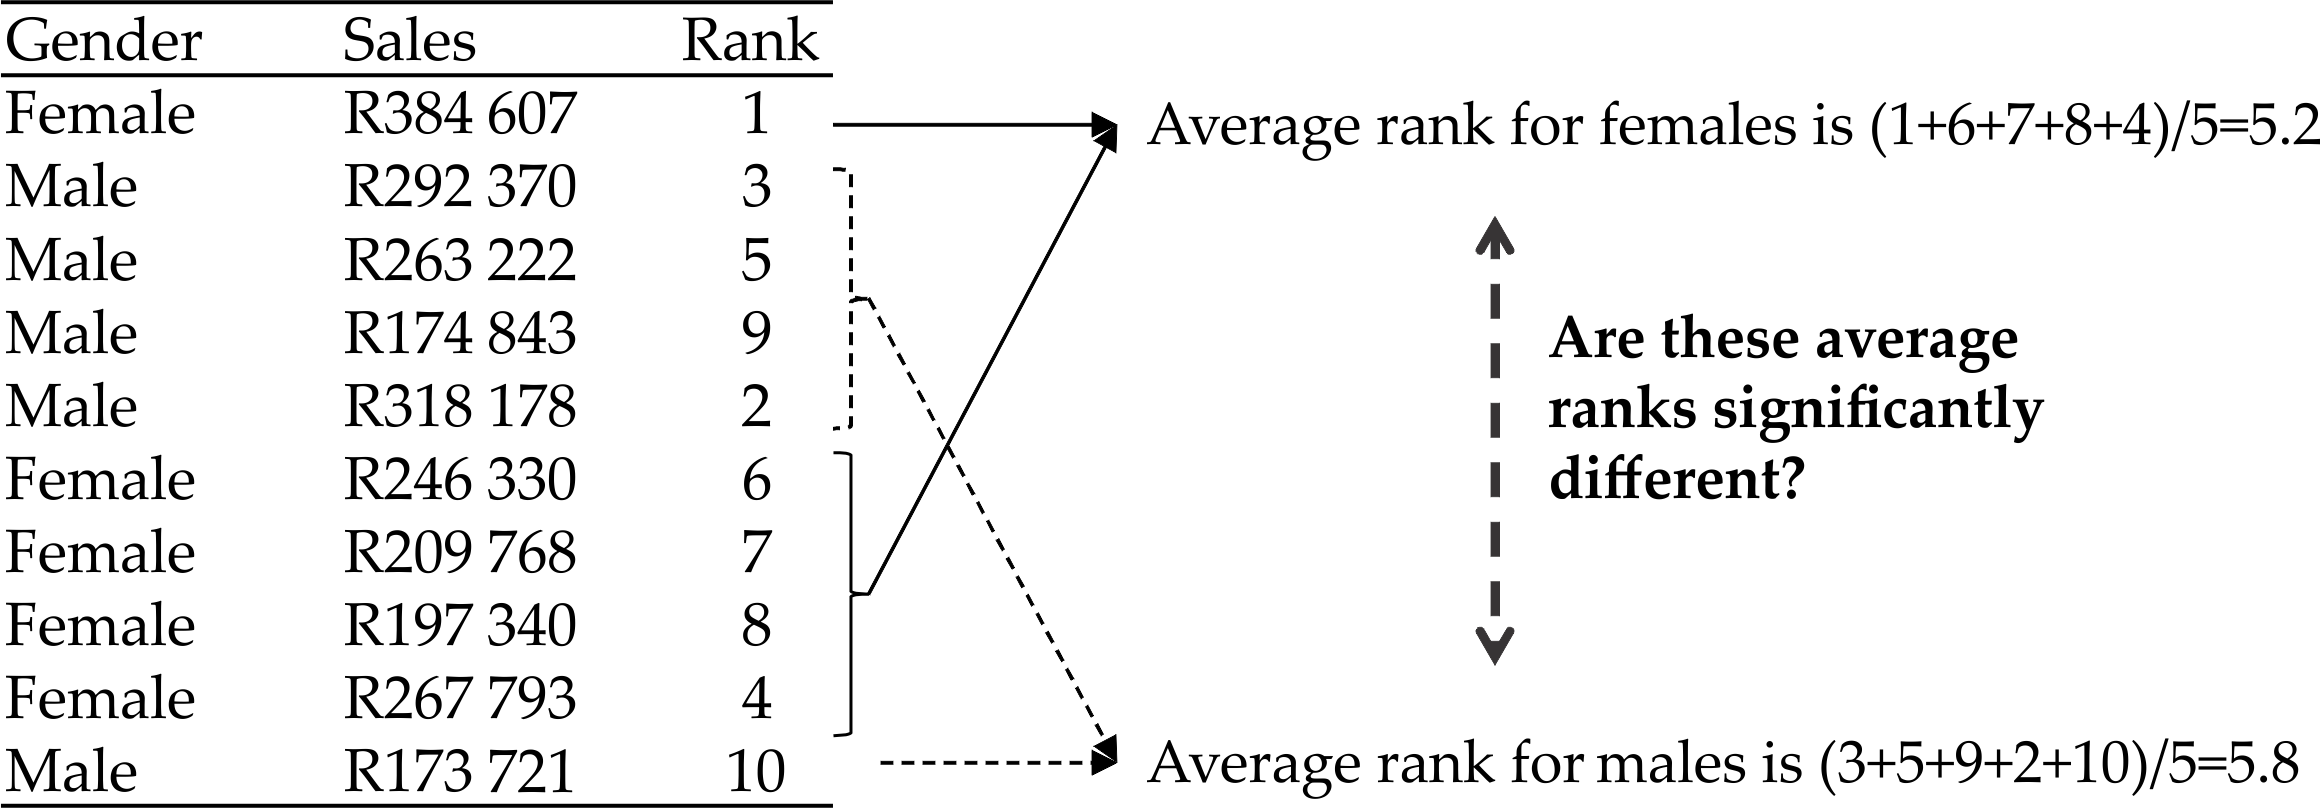
Nonparametric tests of this nature simply then compare the averages or median of the
ranks within the subgroups, rather than the averages of the original data. Figure 14.2 Ranking of dependent variable for nonparametric comparison also shows this process for mean ranks of the ten salespeople only. There are other
nonparametric tests not based on ranks, however the key point to note is that these
tests often bypass the assumptions of parametric tests. Having said this, each nonparametric
test has its own assumptions, which you should consider.
If you intend to use a parametric (normal) comparison of categories at all, I always suggest (1) bootstrapping (so long as you have reasonably-sized samples) and (2)
also doing a nonparametric test, if available. You can then compare and contrast the
results. If you come out with something very different, you may have had a data problem
originally, and you may need to check. This is not always the case, however, but at
least it’ll force you to dig deeper into your analyses.
Last updated: April 18, 2017
..................Content has been hidden....................
You can't read the all page of ebook, please click here login for view all page.