
Choose Constructs and Variable Measurements
Introduction to Constructs & Variables
Having thought
about who or what you are studying, the next step is to think about
what you are studying about your observations (constructs and variables).
Recall that in the previous
chapter I defined a construct as
the underlying concept that you are trying to measure and a variable as
the actual measurement that gives you data. These are not identical
because you can use different measures (variables) of the same concept
(construct). For instance, I might want to measure the construct ”profitability
of businesses,” but I might generate very different variables
reflecting this construct depending on whether I get data on their
share price data or internal accounting data. There are statistical
techniques that explicitly examine the construct-measured variable
link, notably factor analysis; however, these techniques fall outside
of the scope of this book.
Therefore, another critical
first step in any analysis is to choose which constructs to analyze
(the basic concepts involved) and then to gather actual data on the
constructs. Here are a few considerations.
Choosing Constructs & Associated Data
Importance of Construct Choice
How do
you choose which constructs to include in a data analysis? This is
an important question, as it guides the kind of data you need. The
most desirable situation is to know already what you are interested
in studying, and why it is important. It is true that, sometimes,
you have data but no preconception of the real use or even meaning
of the data. This sometimes happens in exercises such as data mining,
which we discuss briefly later.
However, if you take
a more systematic view, there are various options for the constructs
and associated data that you choose.
Focal Constructs & Data
You will always have one or more constructs
on which you wish to focus, such as revenue (proxied by Sales data
in the Accu-Phi case). Focal constructs are the key concepts of interest
in your study, the things you care about and that stimulated you to
start a research project in the first place. There are several considerations
here.
-
Importance of the focal constructs.: In choosing focal constructs consider first and foremost their importance: Your focal constructs should be chosen out of necessity. You know why you chose the focal constructs (I hope!). You chose them because they are important to you or because they could make a difference if they could be understood, explained or predicted. Or perhaps you chose them because you have a research question about them that could change your business, the industry or your academic community.
-
Aims behind focal constructs: There are various possible aims when analyzing a focus variable. Sometimes you only wish to understand the way they distribute. For instance, you may just wish to examine the relative sizes of companies in a certain industry. However, very often you wish to go further and explain or predict one or more focal variables. For instance, you may wish to explain employee turnover in your company, or predict share value in a stock exchange.
-
Feasibility of measuring the focal constructs: While you may wish to research certain core ideas or constructs because they are important, obviously you need to be able to measure them feasibly. This is crucial and brings us back to the research methods imperatives. Issues to consider here include:
-
Sufficient observations: Whether you can get enough observations of the focal measure and any predictor constructs.
-
Reliability and validity of measures: Whether you have (at least) reliability of the measures underlying focal constructs. In addition, you aim for maximum validity. Basically, if you can’t really get data that measures your construct (e.g. if you wanted to measure company success but realize that your data isn’t really measuring it reliably or at all) then you can’t do good statistics.
-
Cost, difficulty, and ethicality of gathering focal construct data: Obviously some data is harder or more costly to gather, and some data is less or more ethical to gather. I leave these issues to research methodology books and courses, but you must consider whether you actually can gather data for your focal variables.
-
Predictor Constructs (Optional)
Predictors are those constructs that
you believe might explain or predict your
focal constructs. You do not always need predictors. However, you
do need them when you seek to explain or predict one or more focal
constructs using their relationship to other variables.
For example, in the
Chapter 1 Accu-Phi case, constructs such as trust, satisfaction, and
enquiries might be thought of as predictors.
Control Constructs & Data
Often you also seek to include constructs
that in themselves are not of primary interest to you, or even that
you believe explain or predict the focal constructs, but that do express
the relevant environment of
your focal constructs.
Demographic descriptors
and differentiators of your observations (such as individuals or firms)
are often a case in point. Say you want to explain or predict a certain
behavioral concept such as employee turnover. While you might have
good reason to position some demographic constructs as direct predictors
of turnover (e.g. older and longer-tenure staff are less likely to
resign), you may not have strong reason to believe that others (perhaps
those such as gender and race?) would actually cause turnover. Instead,
these other constructs may be included as environmental factors in
a way that is not quite cause-and-effect. Such control variables create
a proper data context for the focal variables.
Understand that if you
do not include measures of crucial control constructs, you are analyzing
your core focal constructs out of their proper context and therefore
you will not quite get the right statistical results in many types
of analyses. When you do analyses that involve balancing multiple
focus and predictor variables against each other, if you do not also
balance these in the context of their environment (as represented
by control constructs), then you may get the wrong picture.
As an example of the
usefulness of controls, I was involved in helping a group of scientists
study Fetal Alcohol Syndrome (damage to babies in the womb due to
mothers drinking). Fetal Alcohol Syndrome damages many things, including
growth (in this case, the focus variable). In this particular study
they injected all the pregnant mice with alcohol and some of the mice
with methanol. The idea was to test whether the growth in the babies,
once born, was better among mice injected with or without methanol.
The basic data showed no difference, however the data did not include
the genders of the babies! Obviously male mice grow bigger and faster
than female mice. So, when I included gender as a control variable,
the data then showed an effect for the methanol. Gender was an important
control variable in the context of babies’ growth; without
it, the patterns in the data were obscured.
Conclusion on Construct & Data Choice
The basic lesson of
the very first step is that you will always have constructs on which
you want to focus (focal constructs), sometimes you wish to explain
or predict these using other predictor constructs (not always), and
sometimes you wish to analyze your focal constructs in their relevant
context as represented by control constructs (not always).
Gathering Data: Question & Answer Formats
Question & Answer Format Issues
Each time you gather
a piece of data to capture into a database, in some way you are implicitly
asking a question, even if it is not expressed verbally. There are
three major considerations when deciding how to gather data:
-
What are we asking for? This involves the question formats: the content and format of the questions we are asking.
-
Who are we asking? This involves from whom we are trying the get answers.
-
How are we asking? This involves answer formats: the way we are inviting answers to be given.
Question Formats & Data Sources
With regard to question formats and who we are asking,
there is a lot to think about.
First, there are various
ways to gather data, that is, various ways to ask the questions. Some
of these options include:
-
Using existing data: In business, a lot of data already exists in databases within or without the business, and the data is at least partially ready to be accessed. Examples here include existing customer databases, stock lists, and the like. We usually gather existing data from databases through business intelligence software queries. Chapter 18 discusses some challenges around data storage and access in businesses.
-
Real-time data from sensor data or other recording devices: Although already-existing datasets are common in firms, some data may be gathered in real time through computer-based recordings, such as recording website clicks by customers. Some may also come from physical sensors in various locations and processes, such as GPS sensors that measure the location and movement of your logistics fleet. You can place this data into storage in datasets, but increasingly we seek to analyze it as it is generated. Chapter 18 discusses this in more detail.
-
Speaking to people face-to-face and recording their answers: This can be a good method as it encourages communication about the meaning of questions and answers, and therefore improves clarity and focus. Interviews and focus groups fall into this category. However, this data gathering method is time consuming and expensive.
-
Asking respondents to fill in a survey or form of some kind: For example, an employment application form is a type of data gathering.
-
And so on – there are many data gathering methods!
The main point to consider
here is which data gathering method best suits your needs. GPS data
on your logistics fleet may exist, but it may not be the best data
for answering questions about why drivers
stop.
Second, each question
can have more or less accuracy and specificity about exactly what
it is you are asking for. A specific question
or data query can be expected to give more precise answers, and therefore
better data. But beware: you need to be very sure of whether you are
being as specific as you think you are. For example, how do you ascertain
a customer’s age?
-
If you just ask for an age, some will give you an age based on an upcoming birthday and some will base the answer on the most recent birthday. Being more specific and asking for age based on the most recent birthday, for instance, would be more accurate.
-
Even more accurate, you could ask the person for a birth date. This will be accurate to the day as long as the person tells you the truth and you record it correctly.
As stated previously,
always try to think of a way to get continuous (ratio or interval)
data, so long as this is feasible. Sometimes this is not possible:
gender, for instance, will always be categorical. But at other times,
asking things in ordinal categories, such as age bands, provides inferior
data to asking for more finely tuned data (as in the example of age
question formats above). In this regard, there is a trade-off sometimes
in terms of quality of data vs. complexity, for which see the answer
format material in the next section.
Third, some question
formats involve broad, open-ended questions, such as ”where
do you see yourself in five years’ time?”. Such query
formats can obviously be expected to render very diverse answers dealing
with lots of issues. You may need to do what is called content
analysis on such data, where you break it down
and do intermediate analysis on the content of the answers before
it can be put into an analytics process. This relies on the analyst
to have certain qualitative research skills.
In a similar vein, more
subjective questions, such as people’s mental states or conditions
(e.g. personality assessments), may need careful psychometric development
before the questions are usable. In such cases using previously-developed
question formats or sets is a good idea. Also, when assessing more
subjective or hard-to-measure variables, it is often a good idea to
ask more than one question about the variable. This would require
a multi-item scale; see the next section for more on this.
Formats
Even with the
same question, you can invite people to answer in
different ways. For example, think of the question “Do you
trust Accu-Phi’s cloud storage to keep your accounting data
safe?” You could ask this in an informal interview or a focus
group, and invite open-ended answers. Alternately, you could re-cast
it as an invitation in a customer survey for people to respond to
the statement “I trust Accu-Phi’s cloud storage to keep
our accounting data safe,” and invite answers on a very specific
answer format, which could then take various forms. The way you invite
people to answer questions is important.
Several issues arise
when thinking about answer formats. Again, specificity can be important.
For example, you might ask in an employee form, “How long did
you work in your last job ______________”. When thinking about
this example, consider the following points:
-
This question could result in answers that are expressed in years or months, or both. People who worked in their last job for some years and some months (e.g. one year and four months) might round it off to the nearest year, which would weaken the accuracy.
-
Even worse, someone could put a number (e.g. ”6”) without stipulating whether he or she means months or years.
-
Instead, asking “How long did you work in your last job (answer as accurately as possible to the nearest month): ___ years ___ months” would result in much better data.
When providing people with a specific
answer scale you need to decide how to structure it. For example you
could ask people to respond to the statement “I am satisfied
with my career development options here.” You could offer them
an answer scale as seen in Figure 4.1 Example of a question with a Likert scaled answer format (a
Likert-type scale):
Figure 4.1 Example of a question with a Likert scaled answer format

Or,
you could use something like the format seen in Figure 4.2 A semantic differential answer format with an online slider scale (a semantic
differential scale that is completed online using a slider that the
respondent can slide anywhere between the two extremes):
Figure 4.2 A semantic differential answer format with an online slider
scale

Once again, see methodology
books for various other response formats. There are many such formats.
One mistake beginners make in research using surveys or similar instruments
is to ask too many questions using the same response format, for example,
fifty questions on five issues all of which are assigned the classic
five-point Likert response format from Strongly Disagree to Strongly
Agree. This is monotonous and often leads to poor responder engagement
with the survey, whereas mixing up the answer format can help.
With regard to such
formally-structured answer scales, several considerations arise. One
is how to capture the data. You would often capture the answer as
a number in the datasheet (e.g. if a respondent ticks the third option
in the alternate semantic differential scale below, perhaps capture
this as a ”3”, as in Figure 4.3 Correspondence between survey answer data entry below).
Figure 4.3 Correspondence between survey answer data entry

How many response options
should you give? In the Likert example above there were five options;
in the semantic differential scale there might be a wide range, depending
on how the sliding scale works. This question is a hotly debated one
in the world of research methodology:
-
For the purposes of doing any serious analysis where the data runs from low to high, at least five answer options is good, seven is generally better, but exceeding ten can be too complex for the respondent.
-
Computer-based answer formats, where the person answers on the computer screen, can allow for more accurate answer formats (e.g. where the person slides a marker between two points on a scale as in Figure 4.2 A semantic differential answer format with an online slider scale.) The exact position of the slider from the far left edge can be estimated by the computer exactly.
-
If the question regards picking one or more options in an arbitrary list (e.g. a list of recruitment sources from which the person was recruited, or a list of office supplies the person uses regularly) then the number of response items is not really limited.
As stated above, in
some cases we need to ask more than one question about a variable
to start measuring it accurately. This is dealt with next.
Designing Multi-Item Measures
In data analysis, we often have only
one measurement of a variable. In employee records, for example, we
may only have one data entry for employee age, start date, etc. This
is fine when the data is a measurement of something very objective
and when there is little scope for measurement error.
Sometimes however we are measuring
something that is very subjective, or might have high scope for measurement
error. Psychometric measures, for example, when we are surveying people
about subjective mental constructs such as satisfaction, are far trickier.
In such cases, there is a greater risk of measurement error, since
people understand survey questions differently. For instance, asking
employees in a survey, “Are you satisfied with your job?”
might be construed as:
-
“Do you like your job, that is, just the tasks that you do?”
-
“Are you satisfied with all the job elements, that is, not just the tasks but also the pay, working conditions, etc.?”
-
“Are you happy with the whole company, including elements like their corporate ethics?”
These differences in
interpretation or understanding make the answers less reliable. In
addition, a given single-item measure might be biased by other things,
such as an employee rushing to fill in the survey and not really thinking
hard about a question. Even more objective assessments such as performance
appraisals by supervisors are open to measurement error of various
kinds.
In cases where the interpretation
is in the control of the person organizing the measurements, it is
generally better to gather data on a construct using more than one
measurement. This is referred to as “multi-item
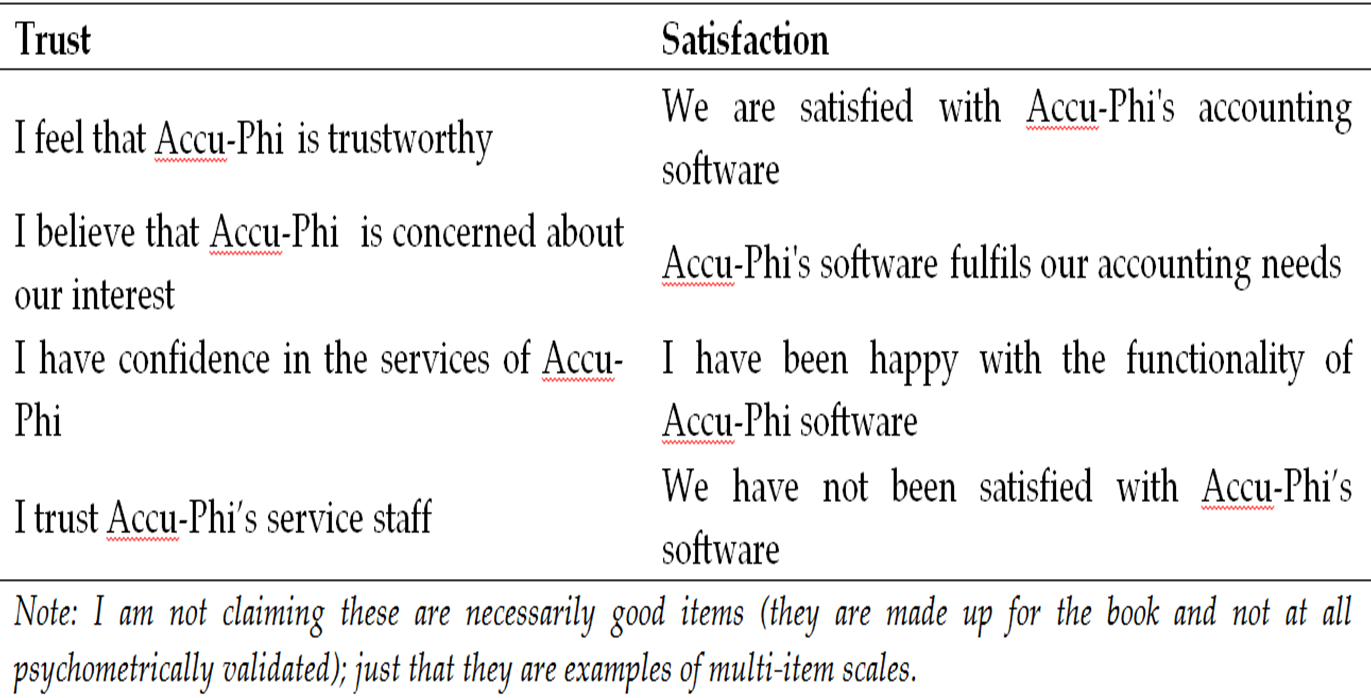
assessment.” In our Chapter 1 Accu-Phi
example, two of the constructs measured (trust and satisfaction) are
measured with multiple questions all asking different aspects of the
construct. For example, we might have constructed a survey using the
questions seen in Figure 4.4 Possible multi-item measures of trust and satisfaction for
each variable.
You will generally be
able to find multi-item scales on most business, psychological, sociological
and other constructs in academic journal articles, which you can often
fairly safety adopt and adapt to your uses. These will have been previously
validated through careful scientific methods. If you wish to use a
previously designed scale – and you probably should, if possible,
since these have been tested for validity – try to find scales
tested and adapted for your local context (geography, industry, and
the like). You often will.
Figure 4.4 Possible multi-item measures of trust and satisfaction
There are two issues
you may wish to consider when designing or choosing multi-item scales:
-
Reverse-worded items. Reverse-worded question items are those that run in the opposite direction to the flow of logic used by the majority of items in the list. For example, in Figure 4.4 Possible multi-item measures of trust and satisfaction, there are four items for satisfaction. The first three are items where a high score indicates high satisfaction. However, the fourth is an item where a high score indicates low satisfaction. These are called “reverse-worded questions.” There are two things to understand about reverse-worded items.
-
The perceived benefits of reverse-worded items. Why would you use reverse questions in the mix? It has traditionally been believed that they work to deter respondents from answering the questions in the list in a less than thoughtful manner, perhaps just answering all of the items in a generally positive manner but without thinking hard about differences in the answers.
-
The downside of reverse-worded items. Unfortunately, the data from reverse-worded items tends to not mix well with the data from the rest of the list, which jeopardizes the reliability of the overall scale. I suggest trying to avoid their use for this reason. However, if you use previously designed scales (especially older ones), they will sometimes include reverse items.
-
-
The ordering of multi-item scales in a bigger research instrument. The second question is whether to keep the items from a multi-item scale together in a research instrument (for instance, in a survey, whether to ask all the trust questions together, one after the other, in a section of the survey). If at all possible, I suggest not keeping the items together, but rather interspersing them between other questions. This keeps respondents from falling into a pattern.
Finally, having designed
your question and answer protocols for data collection, and having
captured the data, you now have to deal with various issues in the
raw data. I discuss these issues next.
Last updated: April 18, 2017
..................Content has been hidden....................
You can't read the all page of ebook, please click here login for view all page.