
You can use the Watson Analytics Refine feature to work with data to both review and/or tweak it to improve its format and level of quality (take note that any changes that you might make are saved as a separate version of the original data).
- To use Watson's Refine feature, you click on the Refine icon:

- Watson will then open the Refine data set dialog, which it lists all of the available datasets. You can search for, or scroll-through, the list (of files) and then select the data to be refined by clicking on it:

- After selecting your data, the Refinement page is opened, showing your data:

Refining your data is sometimes referred to as tuning your data. In an earlier section of this chapter we talked about gathering your data using an external tool. During that process, transformations and reformatting can be done but typically; the work performed on the data at that time is rudimentary in nature, such as combining or merging files, aggregating, and summarizing. Conversely, once the data is loaded into Watson, the things you'll do will be more advanced.
For example, you might want to enrich the data by adding calculations (calculated fields), filter the data to a particular area of focus, or simply make data more usable by renaming columns, changing data types, and modifying the default aggregations. Finally, you might want to create hierarchies and groups within your dataset.
One of the best uses for Watson Refine is to easily assess the quality of each column within your dataset. This is done by viewing the data metrics that Watson automatically provides. To access these Watson-provided metrics, you simply click on the Data Metrics icon:

The data metrics are displayed at the top of each column of data:

As seen in the preceding screenshot, the metrics provided by Watson include a quality score for each column, which indicates a column's potential readiness for use in a Watson prediction (displayed as a numeric value in a green circle); the percentage of data that is missing from each column (written as text: missing values: 00%); and a distribution graph of the data in each numeric column (displayed as a black and white bar graph).
For now, let's look at a simple refinement. Suppose I would like to categorize my trip data into two groups: Day Trips and Overnights. We can do that easily using Watson Refine. To group the data, we can create a Data group column on the column named Overnight:
- Click on the Action Icon:
- Next, under the horizontal fields list (on the left of the page) click on the Data group icon:

- Watson will display the Data group dialog (shown in the following screenshot). Here, you can click on the column name to select the column you want to create the group on (Overnight). Watson then will display the unique values found in that column. In this example, there are only two unique values: Yes and No:

- Next, click (to select) the value No, click on New group, type a name for this group, such as DayTrip, then click OK:

- Notice that, in the preceding screenshot, on the lower left, Watson asks you, Group remaining (1)? Of course, we want to group the value, so click on Yes. Then once again click on New group, type the name of this group (OverNighter) and then click OK:

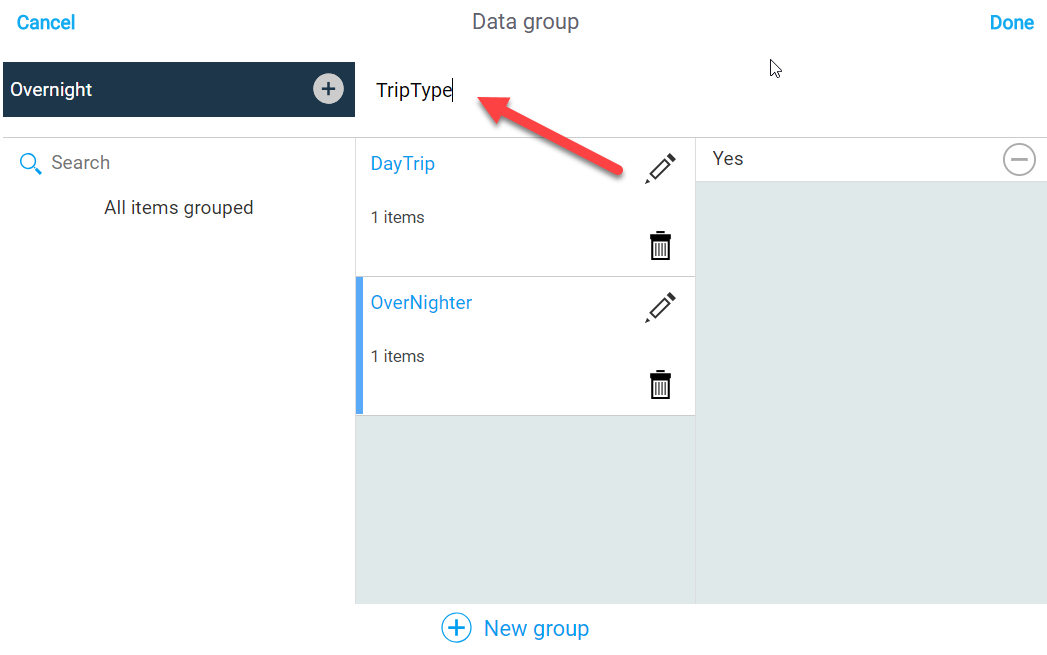
- Finally, we need to Enter a name for our new column (you cannot leave this screen without one) so we enter TripType and then click Done:
- Now, our data group column TripType is part of our data set:

The objective of organizing your data into groups is to make the data easier to read and analyze. There are two kinds of group you can create in Watson, depending on the data type of the column (numeric or alphanumeric). We have just created an alphanumeric data group using the Yes/No raw data values. The group serves to make the data more readable, as DayTrip and OverNighter are perhaps more obvious than No and Yes. Another useful example of using a data group is on a numeric data column. With numeric columns, we can create groups that are ranges.
To illustrate, let's suppose that our organization's management purchased the firm in 2003, so they want to group the trip data in two groups; one will be trips prior to the purchase (the years 2001 and 2002) and the other group will be trips that occurred in 2003 and beyond:
