
10.20. Charting Controls
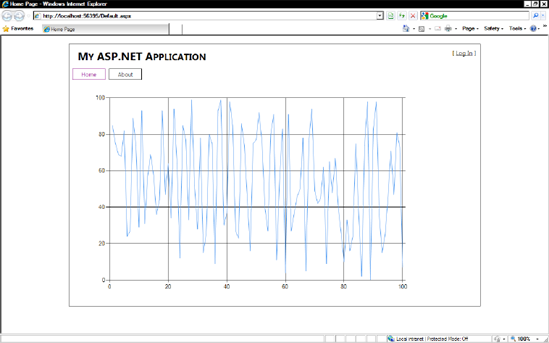
Microsoft purchased and integrated the Dundas ASP.NET charting controls in early 2008. This set contains more than 35 types of charts and a huge amount of functionality, some of which is shown in Figure 10-7. Previously, you had to install these controls as an add-on and add a number of settings to Web.config. ASP.NET 4.0, however, includes these controls, and it is no longer necessary to make changes to Web.config to include them.
Figure 10.7. A simple ASP.NET chart
To add a chart to your web page, simply drag the Chart control from the Toolbox or add a reference to System.Web.DataVisualization and the following Register directive (note this may be slightly different for the final release of VS2010):
<%@ Register Assembly="System.Web.DataVisualization, Version=4.0.0.0, Culture=neutral,
             PublicKeyToken=31bf3856ad364e35"
             Namespace="System.Web.UI.DataVisualization.Charting" TagPrefix="asp" %>
Charts are then added to the page with the following code:
<asp:Chart runat="server">
    <series><asp:Series Name="Series1"></asp:Series></series>
    <chartareas><asp:ChartArea Name="ChartArea1"></asp:ChartArea></chartareas>
</asp:Chart>
The following code binds a series of random points to the chart:
Random r = new Random();
Series series = new Series("Line");
series.ChartType = SeriesChartType.Line;

for (int i = 0; i < 100; i++)
{
    series.Points.AddY(r.Next(0,100));
}

chart1.Series.Add(series);