
5.5. Parallel Debugging Enhancements
Writing parallel and threaded applications is hard. To help, Microsoft has added additional debugging features to the Visual Studio IDE (premium versions include additional profiling features). To demonstrate these features, we will create a new simple console application.
Create a new project called Chapter5.Debugging and enter the following code:
using System.Threading.Tasks;

static void Main(string[] args)
{
   Task task1 = Task.Factory.StartNew(() => startAnotherTask());
   Task task2 = Task.Factory.StartNew(() => startAnotherTask());
   Task task3 = Task.Factory.StartNew(() => doSomething());
   Console.ReadKey();
}

static void startAnotherTask()
{
   Task task4 = Task.Factory.StartNew(() => doSomethingElse());
}

static void doSomething()
{
   System.Threading.Thread.Sleep(500000);
}

static void doSomethingElse()
{
   System.Threading.Thread.Sleep(500000);
}
Put a breakpoint on the line that reads as follows:
Task task3 = Task.Factory.StartNew(() => doSomething());
The first feature we will look at is the Parallel Task window.
5.5.1. Parallel Task Window
This window shows you all the tasks that are currently running and contains features for filtering and jumping directly to where the task is declared.
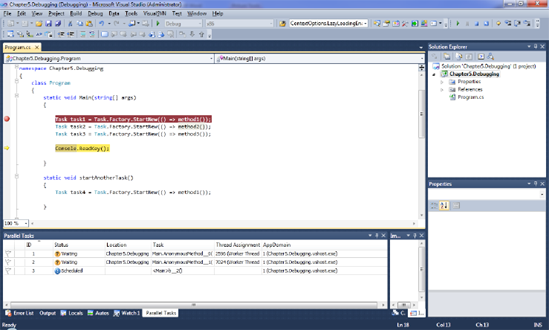
Run the application in debug mode, ensuring you have added a breakpoint as described above. When the breakpoint is hit on the main menu, go to Debug— Windows— Parallel Tasks (Ctrl+Shift+D+K) to open the Parallel Tasks window. The Parallel Tasks window allows you to easily see the current status of tasks.
Now press F10 to move the debugger to the next line and the window should look similar to Figure 5-5.
Figure 5.5. Parallel Tasks debugging window
The Parallel Tasks window offers the following functionality:
You can order the view by clicking the column headings.
You can group tasks by status by right-clicking the status column and selecting Group by status.
To show more detail about a task, right-click any of the headings and check the options you want to view. Note that Parent is a useful option that displays the ID of the parent task that created it (if any).
You can double-click the task to be taken into the code that task is running.
Tasks can be flagged to help you identify them and filter views. To flag a task, simply click the flag icon on the left side.
Tasks can have one of four statuses: running, scheduled, waiting, or waiting-deadlocked. If you have a task with waiting or waiting-deadlocked status, move the mouse over the task to display a tooltip of what it is currently waiting for.
Tasks can be frozen by right-clicking them and selecting the Freeze Assigned Thread option. Select the Thaw Assigned thread option to unfreeze them.
|

5.5.2. Parallel Stacks Window
The Parallel Stacks window enables you to visualize multiple call stacks within one window. It operates in two modes, Task and Thread, which can be changed in the drop-down menu in the left corner.
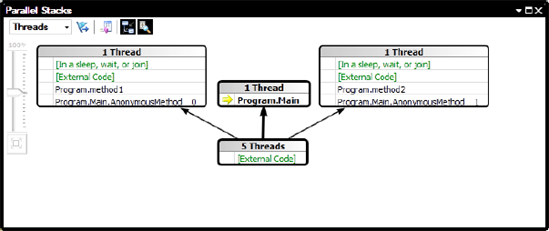
We will take a look at the Thread mode (the Task mode is very similar, but shows only tasks), so make sure that Threads is selected in the drop-down menu (Figure 5-6).
Figure 5.6. Parallel Stacks window: Thread view
At first the Parallel Stacks window can look a bit confusing:
Threads are grouped together by the method (context) they are currently in, indicated by a box.
The blue border around a box shows that the current thread belongs to that box.
The yellow arrow indicates the active stack frame of the currently executing thread (in this case, the main method).
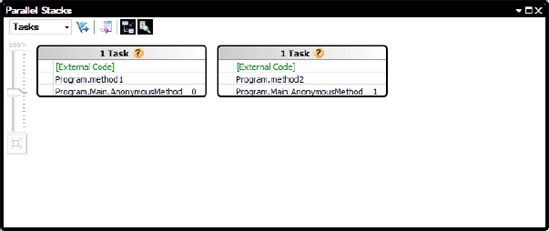
Figure 5-7 shows the Parallel Stacks window operating in Task mode.
Figure 5.7. Parallel Stack window: Task view
The Parallel Stacks window offers the following functionality:
If you hover the mouse over a box, the current associated thread ID will be shown in the tooltip.
You can jump to the individual associated frames by right-clicking a box and selecting Switch to Frame on the context menu.
If a box is associated to only one thread (indicated by a 1 in the box's header), you can double-click the box to be taken to the code associated with that stack frame.
There are a number of view options on the Parallel Stacks window. Reading from left to right, they are as follows:
Show only flagged: Filters whether currently flagged tasks are displayed.
Toggle method view: Select a box on the diagram and then select this option. The current method then appears in the center of the view, showing the methods that call and are called from this method.
Toggle top down/bottom up display: The default is that the initial thread is shown at the base of the view with subsequent calls above it. Select this option to invert the display.
AutoScroll option: Moves the windows focus automatically as you step through the code to the currently executing frame.
Toggle Zoom Control option: Controls whether to display zoom control to the left of the diagram. Note that you can zoom in and out by pressing Ctrl and moving the mouse scroll wheel.
Birds-eye view button: On larger diagrams, when scrollbars are visible in the Parallel Stacks window, you can click between them to quickly move around the diagram.
Individual threads: Right-clicking an individual thread brings up a context menu that allows you to switch to the task, frame, source code, setup symbols, and so on.
NOTE
We have barely scratched the surface of the new debugging facilities - Daniel Moth has recorded some great screencasts and written some excellent articles on parallel debugging at www.danielmoth.com/Blog/2009/11/parallel-debugging.html.