17.3. Using the Common Data View Control Tasks
Now that you understand how to use the SharePoint Designer interface to insert a Data Form Web Part as a data view and a data form, I take you through some enhanced XSL formatting features that are available for Data Form Web Parts.
As mentioned earlier, the Data Form Web Part is made very powerful by the fact that it supports formatting via XSL transformations. Most of the filtering, sorting, grouping, formatting, etc., for the Data Form Web Part is implemented by using XSLT. However, you don't need to be an XSLT expert to work with the Data Form Web Part in SharePoint Designer because the functionality is exposed by using a simple user interface that writes XSL for you behind the scenes.
Bring up the Common Data View Tasks menu for a Data Form Web Part to see the options to enhance the Data Form Web Part functions. While I discuss filtering, sorting, and grouping, I want to quickly mention the following options for data view display and preview:
Edit Columns: Opens a dialog box that allows you to choose the columns that need to be displayed in the view. You can add, remove, and change the order of the columns to be displayed.
Data View Preview: You can use this menu option to specify how the preview of data view should appear in the Design view of SharePoint Designer. You can choose to hide all filters or limit the number of rows when showing the data view in the Design view.
Show with sample data: Provides a way to avoid performance overhead by displaying the data view by using sample data rather than the original data from the data source
Refresh Data View: Allows you to refresh the data view by requesting the data from the data source again
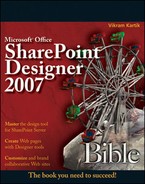
Choosing the Data View Properties menu option takes you to the Data View Properties dialog box, as shown in Figure 17.21. This dialog box allows you to make some general settings related to enabling filtering, sorting, and grouping toolbars; specifying settings for paging; and choosing layouts for the Data Form Web Part.
Figure 17.21. The General tab for the Data View Properties dialog box

The General tab allows you to enable the following abilities for the Data Form Web Part:
Toolbar: The options in this section allow to you enable a filtering, sorting, and grouping toolbar for your data view. Alternatively, you can click the Enable sorting and filtering on column headers check box to enable sorting and filtering on the column headers. Figure 17.22 shows what the column headers look like when sorting and filtering is enabled on them.
Figure 17.22. Sorting and filtering column headers

Header and Footer: The Header and Footer section allows you to show header, footer, and column summary rows for the data view table. For example, you can click the Show column summary row check box if you need to create a row of totals at the bottom of a data view.
No Matching Item text: Clicking the Display text if no matching items are found check box allows you to set the text that should be displayed on the data view if no matching records are found in the data source.
The Layout tab in the Data View Properties dialog box allows you to choose from a list of styles and the layout that needs to be applied to the data view. When you select a layout, a short description of the layout style is displayed at the bottom in the dialog box. If you want to transform the data being shown in the Data Form Web Part by using a custom XSL code, you can click the XSLT Source tab to specify the location of the XSLT source file. This option is useful when you want to share your custom XSLT with other designers.
17.3.1. Implementing filtering, sorting, and grouping
The SharePoint Designer user interface allows you to perform advanced filtering, sorting, and grouping on the rows that are presented by using the Data Form Web Part. Internally, SharePoint Designer implements these operations by using XSLT and XPATH expressions, which are stored in the <XSL> section of the Data Form Web Part code.
17.3.1.1. Appling XSLT filters
If you want to filter the rows of data shown in the data view based on a certain criteria, you can implement filtering by using the Common Data View Tasks menu in the Design view. The next exercise shows you how to use the Filter Criteria dialog box to create filters for your data view. Follow these steps:
Create a new ASPX page in your SharePoint Web site by using SharePoint Designer.
Click the Filter menu option in the Common Data View Tasks menu to open the Filter Criteria dialog box, as shown in Figure 17.23.
In the Field Name column, click the dropdown menu, choose the field that you want to base the filter on, and then select the operator in the dropdown menu for the Comparison column.
Using the And/Or column, specify how you want to combine the filter clauses. For example, the AND operator matches all rows that match multiple clauses, while the OR operation matches either.
Repeat steps 3 to 6 to create multiple filter clauses. To remove a filter clause, simply right-click on it and then click Remove from the popup menu. Figure 17.24 shows the Filter Criteria dialog box with multiple clauses applied.
To group multiple clauses in the Filter Criteria dialog box, hold Shift, select the filter clauses you want to group, and then click Group.

Figure 17.24. Multiple filter clauses in the Filter Criteria dialog box

After you apply a filter criterion to a data view, the Filter menu option in the Common Data View Tasks menu shows the portion of the filter that fits in the menu. You can modify the filter by clicking the Filter menu option.
If you click the Code view tab, the filter has been implemented as an XPath expression in the XSL section of the Data Form Web Part code:
<xsl:variable name="Rows" select="/catalog/book[ ( contains(normalize-space(author), 'O') or contains(normalize- space(author), 'o')) and number(price) < '10']"/>
You can also view this advanced filter expression by clicking the Advanced button in the Filter Criteria dialog box to open the Advanced Condition dialog box, as shown in Figure 17.25.
Later in this section, I discuss creating Advanced XSLT expressions for data views in SharePoint Designer.
17.3.1.2. Enabling sorting and grouping
Using the Common Data View Tasks menu for the Data Form Web Part, click the Sorting menu option to specify the sorting expression for the rows in the data view by using the Sort and Group dialog box, as shown in Figure 17.26.
Simply add the fields you want to sort and group by clicking Add to move them to the Sort Order list. Then, click the field to specify the sorting order and grouping settings on the field. You can enable the group header and group footer by using the check boxes, as shown in Figure 17.26.
NOTE
For SharePoint data sources like lists and libraries, the Data Form Web Part currently supports grouping up to seven levels. This means that you can group rows based on the first column in the list, then on the second column, up to seven column levels.
Clicking Advanced Grouping allows you to choose from a number of options, allowing you to create column totals per group, maintain groups while paging, etc.
Figure 17.25. The Advanced Condition dialog box

Figure 17.26. The Sort and Group dialog box

17.3.2. Working with parameters
One of the other cool features that SharePoint Designer provides is the ability to create parameters for use in operations based on user inputs. For example, you can request user interaction on your Web page by using a form and then use parameters to pass user input from the form to a Data Form Web Part to perform operations such as data filtering, sorting, etc.
While this feature is available for use in Data View Web Parts in WSS v2/SPS 2003, the FrontPage 2003 client doesn't provide any user interface to create parameters. The designers have to manually add the parameters in the Data View Web Part code. SharePoint Designer provides designers with the ability to create parameters without having to directly modify the Data Form Web Part code for WSS v3/MOSS sites. You can create a parameter by using the user interface and specify the source for the parameter. The following are the sources that you can use with parameters:
Control: To be able to use user controls, such as text boxes, dropdown menus, etc., placed on the Web page as a source for the parameter value
Cookie: Allows you to use values from an HTTP cookie as a source for the parameter value
Form: Enables you to use the HTML form data as the source for the parameter
Query String: Allows you to use the query strings specified in the URL of the HTTP request as a source for the parameter value
Server Variable: To be able to use the HTTP server variables, such as SERVER_NAME, LOGON_USER, etc., as a value for the parameter
The following exercise illustrates how you can use parameters in the Data Form Web Part to filter data based on user inputs.
In these steps, you create a data view for a data source, which can be filtered based on user selection in a dropdown menu, which is populated from a column in another data source. As a prerequisite to this exercise, you need a couple of related tables in a database — one to use as a data source for the dropdown menu and the other as the data source for the Data Form Web Part:
Create a new ASPX page in your SharePoint Web site by using SharePoint Designer, open it in the Design view, and then place the cursor inside the Web page in the Design view.
Using the Data Source Library task pane, click the data source that will serve the dropdown list control and then click the Insert Data Source Control menu option. A data source control is inserted on the Web page based on the nature of the data source. For example, the SQLDataSource control is inserted for a Database Connection. An HTML form is automatically inserted on the page to host the data source control.
Choose the data source inserted on the page in step 2, the data field to be used as display text, and the data field to be used as the value for the dropdown list and then click OK. This binds the dropdown list control to the data source control inserted in step 2.
Place the cursor at the location outside the HTML form where you want to insert the data view by using the Data Form Web Part.
Select the columns you want to display in the data view and then choose Insert Selected Fields as
 Multiple Item View. A data view for the data source is inserted in the Web page and the Common Data View Tasks menu opens.
In the Common Data View Tasks menu, choose the Parameters menu option. The Data View Parameters dialog box, as shown in Figure 17.27, opens. You use this dialog box to create new parameters for the data view.
Click New Parameter to create a new parameter and then give the parameter a name by using the highlighted list box.
Using the Parameter Source dropdown menu, select the source for this parameter. For this exercise, choose Control as the parameter source. This enables the Control ID dropdown menu.
Choose the control ID for the dropdown menu inserted in step 3 and then click OK. Figure 17.28 shows the Data View Parameters dialog box with a parameter created.
Using the Common Data View Tasks menu, choose the Filter menu option. The Filter Criteria dialog box opens.
Select the field you want to use for filtering the data view, select the comparison operator, and then choose the parameter you just created in the previous steps, as shown in Figure 17.29. Also, notice the Create a new parameter option in the Value dropdown menu. This is another access point to create or modify parameters by using the Data View Parameters dialog box.
Click OK, save the Web page, and then preview it in a browser.
When you select an option in the dropdown menu, the data view is filtered to show only the corresponding rows of data. You can use the concept described above to create multiple parameters and filters based on multiple user inputs.
Figure 17.27. The Data View Parameters dialog box

Figure 17.28. A parameter created by using the Data View Parameters dialog box

Figure 17.29. Creating a filter by using the Filter Criteria dialog box

17.3.3. Using advanced XSLT expressions
After you insert a Data Form Web Part on a Web page, you can use the SharePoint Designer XSLT editing interface to apply XSLT formatting to the data that's shown by the data view. You can use XSL to create advanced filtering and sorting expressions, format data fields, and insert data fields using formulae. The user interface for inserting these advanced XSL expressions is similar and is shown in Figure 17.30.
The Select a field to insert list shows the list of available columns from your data source. You can apply XSL functions to these columns by choosing from a list of function categories available in the Select a function category dropdown menu. Also, notice that when you select a function for applying it to the column, a short description and example on how to use the function is presented in the dialog box.
The Edit the XPath expression box shows the expression as it builds and also provides IntelliSense features to assist in authoring the expressions. A preview of the data that results from the XSL expression is shown at the bottom of the dialog box.
NOTE
It's important to understand that XSL applied to the Data Form Web Part is recursive. So, if you apply XSL formatting to a single data field value in a column, the formatting is applied to all the data field values in that column.
Figure 17.30. The advanced XSLT builder in SharePoint Designer

17.3.3.1. Creating filtering and sorting expressions
You can create advanced XSL expressions for filtering and sorting your data views by using the SharePoint Designer XSL builder interface. For illustration, the following exercise takes you through the steps to filter a data view based on an XSL expression. The idea here is to filter the data view to show only those rows where a column value is less than the average of all the values for the column in the table:
Insert a data view of the data source you want to use for this exercise by using the Data Source Library task pane.
In the Common Data View Tasks menu, choose the Filter menu option. The Filter Criteria dialog box opens.
Using the XSL expression builder, create the XPath expression shown in Figure 17.31. Keep in mind that you should highlight the column to which you want to apply a function. For example, just by highlighting /catalog/books/price in the Edit the XPath expression box and then selecting average in the Select a function to insert converts the resultant expression to sum(/catalog/book/price) div count(/catalog/book/price).
Figure 17.31. Using the XPath builder to create filter expressions

NOTE
Just clicking on the column in the Select a function to insert box inserts the column name only. If you hold Ctrl and then select the column, the complete XPath for the column is inserted.
Click OK twice to implement the filter to the data view.
In the Advanced Condition dialog box, in the Select a function category box, you have the Parameters category. That means you can perform XSL calculations or operations on parameters you're using with your data view to create filters.
For example, prior to filtering the data view based on values of a parameter of Data Time type, you might want to format the parameter value to a specific date format using the FormatDate or FormatDateTime functions in the Date/Time category.
17.3.3.2. Inserting formulae
Using XSL expressions, you can create new columns in your data view based on calculations performed on the existing columns. For example, you can combine the values of a number of columns to show in a single column. So, if you're storing an address in multiple columns in a table, you can use XSL expressions to combine the values of the address columns and show them as one.
The following exercise shows you how to use XSL expressions to create a new column based on calculation. Follow these steps:
Insert a data view of your data source by using the Data Source Library task pane.
Click Edit columns in the Common Data View Tasks menu.
As shown in Figure 17.32 , the concat function is used in the Text/String category to combine three columns to be displayed as one.
Click OK and then save the Web page. The new columns added to the data view now have the values in the three columns concatenated to form a single column.

NOTE
The column header shows the XSL expression that was used to create the column. However, showing this on a Web page isn't really desirable. So, you can edit the column header text in the Design view. After you change the column header text to the value of your choice, the formula column in the Edit Columns dialog box uses this text as the display name.
17.3.3.3. Formatting data fields
As shown in Figure 17.33, by using the Common xsl:value-of Tasks menu, which appears when you click the arrow next to a data field value in a data view, you can format the data field value in a number of ways. For example, if you're storing hyperlinks in a column in a table, you can use this menu to format the data field values as hyperlinks.
In the next steps, you use the Common xsl:value-of Tasks menu to format a column of Float or Number data type as currency:
Insert a data view of a data source that has a column (of number data type) that needs to be displayed as currency.
After you insert the data view, click the arrow on the data field value in a row to open the Common xsl:value-of Tasks menu.
In the Format as dropdown menu, select Currency to open the Format Number dialog box, as shown in Figure 17.34.
Choose the symbol you want to display for the currency and then specify other settings for formatting the number.
Click OK and then save the Web page.
In the preview of the Web page in the Design view, the formatting is applied to all the data field values in the column.
Figure 17.33. Formatting data field values by using the Common xsl:value-of Tasks menu

Figure 17.34. Formatting a number data field as currency
