We have created the issue assignment workflow that will assign the issue to the team member who has the fewest issues assigned. So let's design our Issue Manager dashboard so issue management can be tracked easily. Perform the following steps to create our Issue Manager dashboard:
- Open the
IssueManagersolution and navigate to Components | Entities | Issue. - Select View and click on New.
- Enter the following information in the View properties:
- Name: My Issues
- Description: List of the issue assigned to me
- Click on Add Columns and add the columns that we added while creating the Open Issue view.
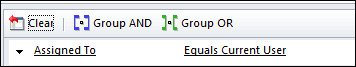
- Click on Edit Filter Criteria, as shown in the following screenshot, and click on OK:
- Click on Save and Close.
We have created a view based on the current user; now let's create a chart control based on the My Issues view.
Microsoft CRM 2011 has introduced a new feature to create charts for a single entity view. Charts help us to graphically represent our organization's data effectively. We can use charts to display information in two axes, horizontal (X) and vertical (Y). The horizontal axis can be used to display numerical as well as non-numerical values, whereas the vertical axis can be used to display only numeric values. We can create the following different charts in Microsoft CRM 2011:
Microsoft CRM 2011 allows us to create two types of charts, namely system charts and user charts. System charts are available to all Microsoft CRM 2011 users, while user charts can be accessed by other CRM users if they are shared or assigned to them.
Let's create our chart with the following steps:
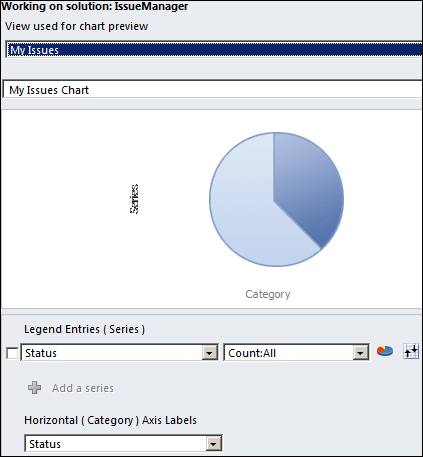
- Select Charts and click on New.
- Select the My Issues view from the view drop-down menu.
- Enter the chart name as
My Issues Chart. - Select the Pie chart from the Chart group in the ribbon toolbar.
- Select the Status field from Legend Entries, and Count All from the Aggregate drop-down menu.
- Select Status from the Horizontal (Category) Axis Labels drop-down menu.
Once done, our chart should look like the following screenshot:
Now we have our view and chart ready so let's create our dashboard and place the My Issues list and chart on it.
Perform the following steps to set up the dashboard:
- Navigate to Workplace | My Work | Dashboard on the CRM home page.
- Click on New and select 2- Column Regular Dashboard, and click on Create.
- Enter
Issue Managerunder the Name section. - Remove existing components and click on List in the ribbon toolbar.
- Select Issue in Record Type and My Issue in View.
- Click on the Chart button on the ribbon toolbar, and select Issue in Record Type, My Issue in View, and My Issue Chart from the Chart drop-down menu.
- Click on Save and Close.
Now our application is ready for testing. The System Administrator can start creating the project and set up development teams. Once the testing resource starts entering the issue, the workflow will start working and assign an issue based on the workflow logic that we developed.
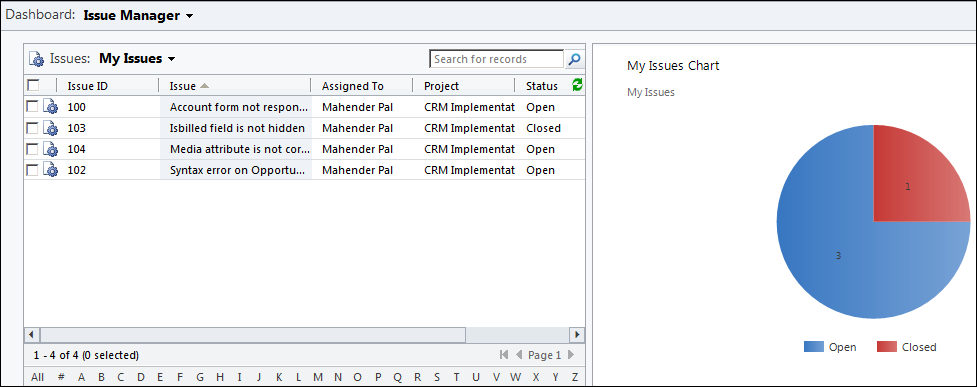
Once the developers start working on the issues, their dashboard should like the following screenshot:
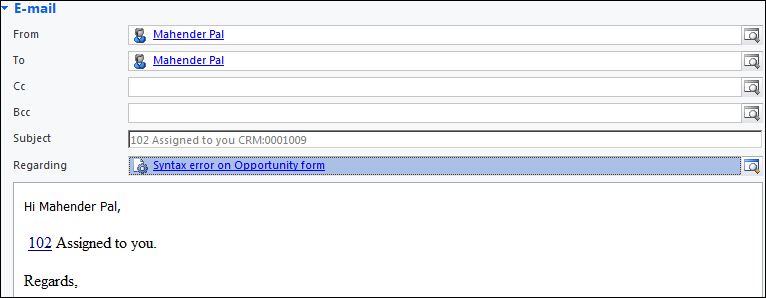
The e-mail notification sent to the team member will look like the following screenshot: