 Bivariate analysis
by Richard Heimann, Nathan Danneman, Pradeepta Mishra, Bater Makhabel
R: Mining Spatial, Text, Web, and Social Media Data
Bivariate analysis
by Richard Heimann, Nathan Danneman, Pradeepta Mishra, Bater Makhabel
R: Mining Spatial, Text, Web, and Social Media Data
- R: Mining Spatial, Text, Web, and Social Media Data
- Table of Contents
- R: Mining Spatial, Text, Web, and Social Media Data
- R: Mining Spatial, Text, Web, and Social Media Data
- Credits
- Preface
- 1. Module 1
- 1. Warming Up
- 2. Mining Frequent Patterns, Associations, and Correlations
- An overview of associations and patterns
- Market basket analysis
- Hybrid association rules mining
- Mining sequence dataset
- The R implementation
- High-performance algorithms
- Time for action
- Summary
- 3. Classification
- Classification
- Generic decision tree induction
- High-value credit card customers classification using ID3
- Web spam detection using C4.5
- Web key resource page judgment using CART
- Trojan traffic identification method and Bayes classification
- Identify spam e-mail and Naïve Bayes classification
- Rule-based classification of player types in computer games and rule-based classification
- Time for action
- Summary
- 4. Advanced Classification
- 5. Cluster Analysis
- 6. Advanced Cluster Analysis
- Customer categorization analysis of e-commerce and DBSCAN
- Clustering web pages and OPTICS
- Visitor analysis in the browser cache and DENCLUE
- Recommendation system and STING
- Web sentiment analysis and CLIQUE
- Opinion mining and WAVE clustering
- User search intent and the EM algorithm
- Customer purchase data analysis and clustering high-dimensional data
- SNS and clustering graph and network data
- Time for action
- Summary
- 7. Outlier Detection
- Credit card fraud detection and statistical methods
- Activity monitoring – the detection of fraud involving mobile phones and proximity-based methods
- Intrusion detection and density-based methods
- Intrusion detection and clustering-based methods
- Monitoring the performance of the web server and classification-based methods
- Detecting novelty in text, topic detection, and mining contextual outliers
- Collective outliers on spatial data
- Outlier detection in high-dimensional data
- Time for action
- Summary
- 8. Mining Stream, Time-series, and Sequence Data
- 9. Graph Mining and Network Analysis
- 10. Mining Text and Web Data
- A. Algorithms and Data Structures
- 2. Module 2
- 1. Data Manipulation Using In-built R Data
- What is data mining?
- Introduction to the R programming language
- Data type conversion
- Sorting and merging dataframes
- Indexing or subsetting dataframes
- Date and time formatting
- Creating new functions
- Loop concepts - the for loop
- Loop concepts - the repeat loop
- Loop concepts - while conditions
- Apply concepts
- String manipulation
- NA and missing value management
- Missing value imputation techniques
- Summary
- 2. Exploratory Data Analysis with Automobile Data
- Univariate data analysis
- Bivariate analysis
- Multivariate analysis
- Understanding distributions and transformation
- Interpreting distributions
- Variable binning or discretizing continuous data
- Contingency tables, bivariate statistics, and checking for data normality
- Hypothesis testing
- Non-parametric methods
- Summary
- 3. Visualize Diamond Dataset
- 4. Regression with Automobile Data
- 5. Market Basket Analysis with Groceries Data
- 6. Clustering with E-commerce Data
- 7. Building a Retail Recommendation Engine
- 8. Dimensionality Reduction
- 9. Applying Neural Network to Healthcare Data
- 1. Data Manipulation Using In-built R Data
- 3. Module 3
- 1. Going Viral
- 2. Getting Started with R
- 3. Mining Twitter with R
- 4. Potentials and Pitfalls of Social Media Data
- 5. Social Media Mining – Fundamentals
- Key concepts of social media mining
- Good data versus bad data
- Understanding sentiments
- Sentiment polarity – data and classification
- Supervised social media mining – lexicon-based sentiment
- Supervised social media mining – Naive Bayes classifiers
- Unsupervised social media mining – Item Response Theory for text scaling
- Summary
- 6. Social Media Mining – Case Studies
- A. Conclusions and Next Steps
- Bibliography
- Index
The relationship or association between two variables is known as bivariate analysis. There are three possible ways of looking at the relationship:
- Numeric-to-numeric relationship
- Numeric-to-categorical relationship
- Categorical-to-categorical relationship
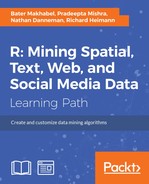
To know the bivariate relationship between two numeric variables, typically a scatter plot is used if the two variables happen to be continuous, and a bar plot is used if one variable is categorical and the other is continuous:
> library(ggplot2)

> library(gridExtra)

> ggplot(Cars93, aes(Cars93$Price,Cars93$MPG.city))+geom_point(aes(colour=(Cars93$Type)))+geom_smooth()
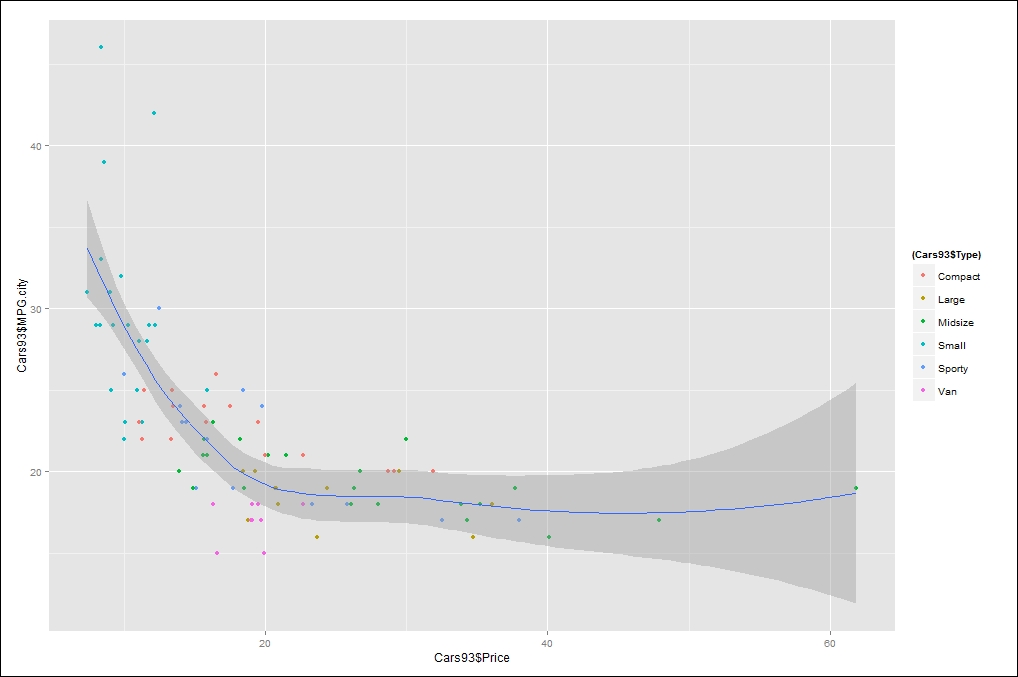
Figure 1: Showing the relationship between price and mileage within a city for different car types
Similarly, the relationship between price and highway mileage can be represented using a scatter plot as well:
> library(ggplot2)

> library(gridExtra)

> ggplot(Cars93, aes(Cars93$Price,Cars93$MPG.highway))+geom_point(aes(colour=(Cars93$Type)))+geom_smooth()
Figure 2: Relationship between price and mileage on highways
The numeric-categorical and two categorical relationships are explained in Chapter 3, Visualize Diamond Dataset, in detail.
-
No Comment