An attribute is a field representing a certain feature, characteristic, or dimensions of a data object.
In most situations, data can be modeled or represented with a matrix, columns for data attributes, and rows for certain data records in the dataset. For other cases, that data cannot be represented with matrices, such as text, time series, images, audio, video, and so forth. The data can be transformed into a matrix by appropriate methods, such as feature extraction.
The type of data attributes arises from its contexts or domains or semantics, and there are numerical, non-numerical, categorical data types or text data. Two views applied to data attributes and descriptions are widely used in data mining and R. They are as follows:
- Data in algebraic or geometric view: The entire dataset can be modeled into a matrix; linear algebraic and abstract algebra plays an important role here.
- Data in probability view: The observed data is treated as multidimensional random variables; each numeric attribute is a random variable. The dimension is the data dimension. Irrespective of whether the value is discrete or continuous, the probability theory can be applied here.
To help you learn R more naturally, we shall adopt a geometric, algebraic, and probabilistic view of the data.
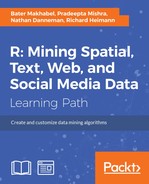
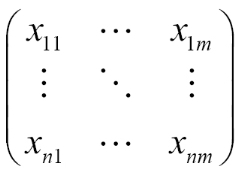
Here is a matrix example. The number of columns is determined by m, which is the dimensionality of data. The number of rows is determined by n, which is the size of dataset.
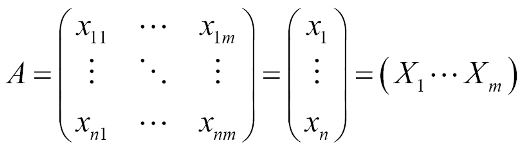
Where ![]() denotes the i row, which is an m-tuple as follows:
denotes the i row, which is an m-tuple as follows:
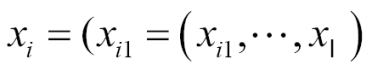
And ![]() denotes the j column, which is an n-tuple as follows:
denotes the j column, which is an n-tuple as follows:
Numerical data is convenient to deal with because it is quantitative and allows arbitrary calculations. The properties of numerical data are the same as integer or float data.
Numeric attributes taken from a finite or countable infinite set of values are called discrete, for example a human being's age, which is the integer value starting from 1,150. Other attributes taken from any real values are called continuous. There are two main kinds of numeric types:
- Interval-scaled: This is the quantitative value, measured on a scale of equal unit, such as the weight of some certain fish in the scale of international metric, such as gram or kilogram.
- Ratio-scaled: This value can be computed by ratios between values in addition to differences between values. It is a numeric attribute with an inherent zero-point; hence, we can say a value is a multiple of another value.
The values of categorical attributes come from a set-valued domain composed of a set of symbols, such as the size of human costumes that are categorized as {S, M, L}. The categorical attributes can be divided into two groups or types:
The basic description can be used to identify features of data, distinguish noise, or outliers. A couple of basic statistical descriptions are as follows:
Data measuring is used in clustering, outlier detection, and classification. It refers to measures of proximity, similarity, and dissimilarity. The similarity value, a real value, between two tuples or data records ranges from 0 to 1, the higher the value the greater the similarity between tuples. Dissimilarity works in the opposite way; the higher the dissimilarity value, the more dissimilar are the two tuples.
For a dataset, data matrix stores the n data tuples in n x m matrix (n tuples and m attributes):
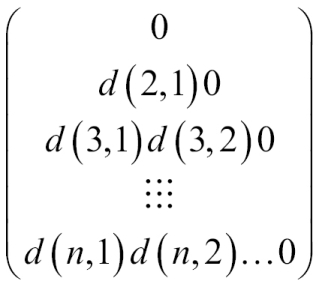
The dissimilarity matrix stores a collection of proximities available for all n tuples in the dataset, often in a n x n matrix. In the following matrix, ![]() means the dissimilarity between two tuples; value 0 for highly similar or near between each other, 1 for completely same, the higher the value, the more dissimilar it is.
means the dissimilarity between two tuples; value 0 for highly similar or near between each other, 1 for completely same, the higher the value, the more dissimilar it is.
Most of the time, the dissimilarity and similarity are related concepts. The similarity measure can often be defined using a function; the expression constructed with measures of dissimilarity, and vice versa.
Here is a table with a list of some of the most used measures for different attribute value types: