
- Open your AL project in Visual Studio Code.
- In Explorer, select Debug SQL Example.al.
In the Editor, click on the following line of code and press F9 to set a breakpoint:
FindRecords();
- Press F5 to deploy and debug the project. When your web browser opens, follow these steps:
- Use the
 icon to search for Debug SQL Example and click on it to open the page.
 - Choose Actions | Find Records.
- On the debugging toolbar in Visual Studio Code, click
 (or press F11) to step into the first function.
 - In the Debug pane, follow these steps:
- Click Locals to expand it.
- Click <Database Statistics> to expand it.
- Click <Last Executed SQL Statements> to expand it.
- Click SQL9 to expand it.
- Use the
- On the debugger toolbar, click to step into the next function.
As you step through the functions, you will notice that the contents of SQL9 (and the other SQL headings for that matter) change to reflect the most recent SQL query that was executed, how long it took to execute, and how many rows it retrieved. All great information to know when you are trying to diagnose performance issues!
You can hover your mouse over the Statement: line to view the entire SQL statement that was executed.
Here is an example:
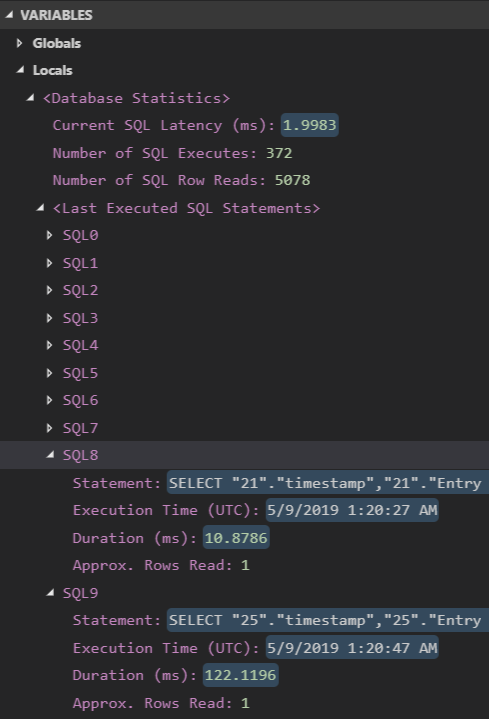
By default, you can see the last 10 SQL statements that were executed. For on-premise installations, you can configure the server to show more or fewer statements.