
- Log in to your development sandbox with your web browser.
- Use the
 icon, search for Web Services, and click the link to open the page.
 - Let's publish a web service so we can see customer data in Power BI:
- Click the
 action button.
 - In the list, in the new row, enter the following information:
- Object Type: Page
- Object ID: 22
- Service Name: customersdemo
- Published: Yes (place a check mark in this column)
- Click the
 action button.
 - Click the
 action button and search for customersdemo:
- You only see the entry that we created in the list.
- Click the
- Select the entry in the list and copy/paste the value into the OData URL column to Notepad for later.
- Do not grab the OData V4 URL value!
- Close the Web Services page.
Remember that you can also publish web services with your Business Central application automatically to save your users' time! See the Publishing your own web service recipe earlier in this chapter for information on how to do it.
- Open Power BI Desktop.
- Let's get connected to the web service that we published in Business Central:
- On the welcome screen, select
 .
. - Select All | OData Feed.
- Click Connect.
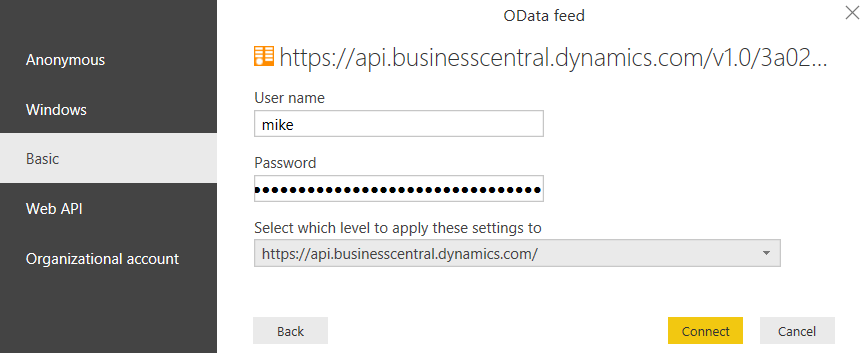
- In the OData feed dialog, make sure that Basic is selected, and paste in the OData URL you copied from Business Central:
- On the welcome screen, select

-
- Click OK.
- Click Basic.
-
- Fill in the following fields:
- User name: Your development sandbox username.
- Password: The web services access key you generated for the user in the Enabling basic authentication recipe earlier in this chapter:
- Fill in the following fields:
-
- Click Connect.
- Click Load.
- Now that we have made the connection to Business Central, Power BI has downloaded the contents of the web service we published. However, some of the data types have not been correctly identified for all fields.
We'll fix that up for a few of the fields:
-
- In the left sidebar of Power BI Desktop, select the Data (
 ) icon.
 - Find and select the Sales_LCY column.
- Select Modelling | Formatting | Data type: Decimal Number.
- Click Yes on the confirmation dialog.
- Repeat steps 2-4 for the Balance_Due_LCY column.
- In the left sidebar of Power BI Desktop, select the Data (
Once you have told Power BI what type of data is in the columns, any time that the data is refreshed, it will enforce those rules.
- Now, let's build a simple visualization of the customer data:
- Click the Report (
 ) icon in the left sidebar in Power BI Desktop.
 - Select Home | New Visual.
- With your new visualization selected, on the right side of the Power BI Desktop window, select the Clustered column chart type:
- Click the Report (

-
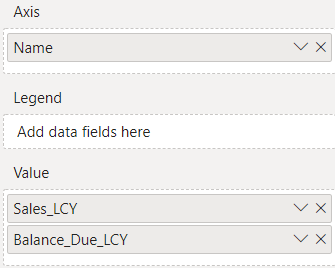
- With the visualization selected, on the right side of the Power BI Desktop window, drag and drop the Axis: Name and Value: Sales_LCY, Balance_Due_LCY fields into the appropriate sections:
-
- Select your visualization and drag the edge out to make it larger. It should look similar to the following:

That's it! You've created a Power BI visualization using the customer data from your Business Central sandbox!