
Speed and velocity
Publisher Summary
This chapter focuses on speed and velocity. Speed is the rate of covering distance. The usual units for speed are meters per second (m/s), or kilometers per hour (km/h). One way of giving data on the motion of an object is graphically. A graph of distance travelled against time is called a distance–time graph. The velocity of an object is the speed of the object in a specified direction. Thus, if a plane is flying due south at 500 km/h, its speed is 500 km/h, but its velocity is 500 km/h due south. It follows that if the plane had flown in a circular path for one hour at a speed of 500 km/h hour, so that one hour after taking off it is again over the airport, its average velocity in the first hour of flight is zero. A graph of velocity against time is called a velocity–time graph.
The usual units for speed are metres per second (m/s or m s−1), or kilometres per hour (km/h or km h−1). Thus if a person walks 5 kilometres in 1 hour, the speed of the person is 5/1, that is, 5 kilometres per hour.
The symbol for the SI unit of speed and velocity is written as ’m s−1’, called the ’index notation’. However, engineers usually use the symbol m/s, called the ’oblique notation’, and it is this notation which is largely used in this chapter and other chapters on mechanics. One of the exceptions is when labelling the axes of graphs, when two obliques occur, and in this case the index notation is used. Thus for speed or velocity, the axis markings are speed/m s−1 or velocity/m s−1.
2. One way of giving data on the motion of an object is graphically. A graph of distance travelled (the scale on the vertical axis of the graph), against time (the scale on the horizontal axis of the graph), is called a distance-time graph. Thus if a plane travels 500 km in its first hour of flight and 750 km in its second hour of flight, then after 2 h, the total distance travelled is (500 + 750) kilometres, that is, 1250 km. The distance-time graph for this flight is shown in Figure 24.1.

3. The average spied is given by
Thus, the average speed of the plane in para. 2 is:
If points O and A are joined in Figure 24.1, the slope of line OA is defined as
for any two points on line OA.
For point A, the change in distance is AX, that is 1250 km, and the change in time is OX, that is, 2 h. Hence the average speed is
Alternatively, for point B on line OA, the change in distance is BY, that is, 625 km and the change in time is OY, that is, 1 h, hence the average speed is
In general, the average speed of an object travelling between points M and N is given by the slope of line MN on the distance-time graph.
4. The velocity of an object is the speed of the object in a specified direction. Thus, if a plane is flying due south at 500 km/h, its speed is 500 km/h, but its velocity is 500 km/h due south. It follows that if the plane had flown in a circular path for one hour at a speed of 500 km/h hour, so that one hour after taking off it is again over the airport, its average velocity in the first hour of flight is zero.
5. The average velocity is given by:
If a plane flies from place O to place A, a distance of 300 km in 1 h, A being due north of O, then OA in Figure 24.2 represents the first hour of flight. It then flies from A to B, a distance of 400 km during the second hour of flight, B being due east of A, thus AB in Figure 24.2 represents its second hour of flight. Its average velocity for the two hour flight is
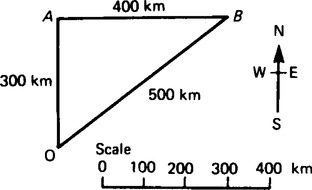
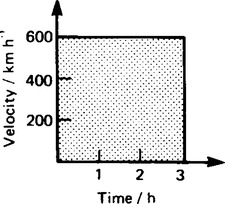
or 250 km/h in direction OB. 6 A graph of velocity (scale on the vertical axis), against time, (scale on the horizontal axis), is called a velocity-time graph. The graph shown in Figure 24.3 represents a plane flying for 3 h at a constant 200 speed of 600 km/h in a specified direction. The shaded area represents velocity, (vertically), multiplied by time (horizontally), and has units of kilometres/hours×hours, i.e. kilometres, and represents the distance travelled in a specific direction.
Another method of determining the distance travelled is from:
Thus if a plane travels due south at 600 km/h for 20 minutes, the distance covered is