
Chapter 5
Analyzing and Monitoring Your Customers
IN THIS CHAPTER
![]() Monitoring your website traffic
Monitoring your website traffic
![]() Interpreting the records left on your web server
Interpreting the records left on your web server
![]() Using software to assemble reports on website usage
Using software to assemble reports on website usage
![]() Implementing techniques to gain more information from your visitors
Implementing techniques to gain more information from your visitors
![]() Asking your customers the right questions
Asking your customers the right questions
![]() Updating your website to correct or improve performance
Updating your website to correct or improve performance
After you build your website, your next step is to ask, “How can I make my site better?” Your initial version is rarely your current version. You create your site, watch how users interact with you, make changes, watch how users react to those changes, make more changes, watch some more, and then repeat the process. This process is ongoing as you evolve your site to meet the changing needs of your customers.
Analyzing your website can tell you a lot about your business that other metrics (measurements) — such as sales volume, average order amount, and repeat customers — cannot tell you. You can figure out exactly which web pages on your site are the most and least popular. You can see how many people start with your home page, and then calculate the average number of pages a user sees before leaving. You can even find out where users come from when they arrive at your website and determine the last thing they see before they leave.
In this chapter, we look at the field of website analysis, from traffic monitoring to gathering customer feedback. We help you break down the massive amount of raw data you have on your site and turn it into useful statistics that can change your business — mainly with sophisticated but easy-to-use software. You find out which pieces of information are more important than others and how to focus your analysis to study individual user behavior. You can then use this data to make useful updates to your website and study the immediate and lasting effect of your changes.
 The best changes that come from website analysis are gradual, or evolutionary, changes. Look at how sites such as Amazon and Yahoo! handle changes. Their interfaces don’t radically change every week, although subtle and gradual changes are always being introduced, to respond to customers and enhance the shopping experience.
Tracking Trends
If you sit at an outdoor café and watch traffic drive by, you begin to get a sense of patterns. You can estimate the number of cars that drive by; determine the most popular makes, models, and colors; establish whether the cars are zooming past or crawling by; and ascertain whether they’re coming in groups or as a continuous stream.
You can apply the same techniques to monitoring your website traffic. If you want to understand the behaviors of the traffic, you need to know basic information and understand the trends that are occurring:
- The number of visitors coming to your website
- The number of unique visitors coming to your site
- Which websites are referring viewers to your site
- Which web pages are the most frequently viewed and the least frequently viewed
- The number of web pages that the average visitor sees in one visit
You can track this usage without monitoring direct website traffic, although this method mainly involves direct customer interaction. You can contact a research group to find sample visitors and perform usability testing, where the research group introduces visitors to your website, asks them to interact with it, and then studies their activities to see whether they can intuitively find their way around your website, place an order, and perform basic functions. Based on these user interactions, the research group makes recommendations to you about changes you should make to your website to make it more user friendly or easier to use.
You can also solicit direct customer feedback through surveys, follow-up phone calls, or e-mail response forms. Many websites gather this feedback by contacting past customers or people who have just ordered something from the website, and then getting their opinions about a variety of issues. This method is useful for identifying issues that need correcting or promoting, or to add insight or qualitative information to the level of your website’s usefulness, beyond what the quantitative information is telling you through trend analysis. Find out more about adding qualitative information in the section “Getting to Know Your Customer,” later in this chapter.
Measuring Website Traffic
Every time your web server receives a request from a visitor and displays a web page for that visitor, it creates an entry for the request in a log file on the web server. The log file records all the activity your website experiences. The server captures a lot of information in this file that you can then use to get a better idea of how your website is being used and operated by visitors and customers.
Thankfully, instead of reading log files to gain this information, there is website software that will read this information and present it to you in an easier-to-follow format, as well as provide reports and charts to give you an idea of trends, highlights, and important information that require your action. Called traffic analysis software, these software programs build a summary of your website traffic criteria and can
- Break apart each log file entry
- Group together similar entries
- Factor out known entries, such as search engine bot programs
- Calculate totals and averages
While there are lots of traffic analysis software options to choose from, we are using Google Analytics in this chapter. Consult with your technical staff or web administrator to see if your particular website comes with analytics software you can use.
When you study website traffic, statistics can help you improve your online business in at least three key areas. Google Analytics summarizes these three areas in an easy-to-follow ABC fashion:
- Acquisition: How do you acquire or get people to your website?
- Behavior: What are your users doing on your website after you acquire them?
- Conversion: How are you turning the casual viewer into someone who buys something (or does a direct action on your site like joining a newsletter)?
In Google Analytics, the Audience Overview section gives you a clear idea of the traffic you are receiving to your website (see Figure 5-1). The Audience Overview looks at a number of statistics, which you can study in an hourly, daily, weekly, or monthly rate (just click the appropriate square in the top-right corner of the report).

FIGURE 5-1: Your analytics reports shows you all the visitors and what they looked at.
Your Audience Overview tells you a lot about your website:
- The average length and number of pages visited on your site
- The “stickiness” of your site, or how long people stay to look around
- The demographic types of visitors who come to your site
- The capability of your site to present your web pages effectively
Defining the terms of traffic analysis
Your website measures a hit whenever a piece of your website, whether it’s a web page or a graphics file or another object, is sent over the Internet to someone’s web browser. You might hear this activity described as “My website got a million hits last month.” That statement is saying that your website handled a million different requests for everything from text to images to audio tracks.
Although some people think of hits purely as visitors, a web page might have nine different graphics and generate 10 hits every time it’s accessed. Why? When a visitor wants to view the web page, the web server sends out the HTML code of the page as the first request, and then the server sends nine separate graphics files, one by one, and records each of those transmissions as a separate hit.
This process is the reason that measuring hits isn’t as important as other metrics, although it does give you a good baseline to understand the level of demand. When you’re talking to advertisers, finding funding, or planning a marketing campaign, a high hit count doesn’t spell success on its own.
A page view, on the other hand, happens when a visitor views a particular page. This number, which is independent of the number of elements that might be present on a web page, usually correlates to the number of visits to a particular page, especially on your home page.
Because most websites have multiple pages, you should be more concerned with the unique number of visits, or unique visitors, to your site. Your analytic software will look at the log files for some identifying information, such as an IP address, and correlate that information to your page views. If the software sees the same IP address viewing multiple pages, it will get an idea of the average number of pages viewed per user.
 An IP address, or Internet Protocol address, is a series of four sets of numbers (in a range from 0 to 256) defining a computer’s location on the Internet. An example of an IP address is
 207.171.166.102 (which belongs to Amazon). Each IP address is unique to one computer at a time. Many users are assigned an IP address dynamically, which means that they’re assigned a unique set of numbers the moment they sign on to the Internet, and they lose the right to those numbers when they’re done. Some people, like those using cable modems or university computers, have the same IP address, or static IP address, all the time.
Most investors, suppliers, and employees, including you, are interested in knowing the number of unique visitors to your website. One of the easiest ways to figure out that number is when your website software implements a system where it places a text file (a cookie) on each visitor’s computer. Turn to the later section “Storing data using cookies” to find out how to use cookies.
Referring to your user acquisitions
In some cases, a separate log file (a referrer file) on your computer contains the sources of all your web page requests. In Google Analytics, this area is called Audience Acquisition, or how you are getting your incoming users. You can see an example of an acquisition report in Figure 5-2. The sources you see are mostly other websites that link to you or search engine links where a visitor has typed certain keywords and found your site as one of the results.
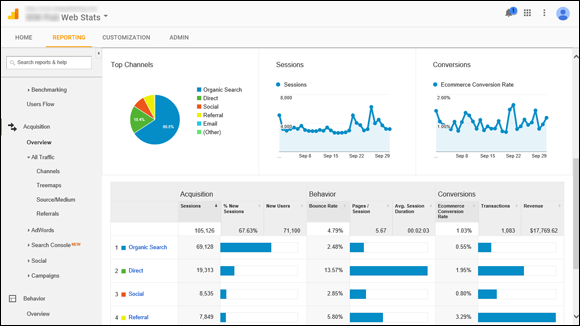
FIGURE 5-2: See where your website visitors are coming from.
For example, organic search means that someone typed keywords into a search engine such as Google and then clicked a link from the search results screen (not an advertisement on that screen, but a link inside the main section of the results screen) to arrive at your website. The beauty of organic search is that, sometimes, the referrer file will capture a link that contains the keywords the visitor typed to eventually end up on your site. This information alone can be invaluable when you’re planning web-marketing campaigns. (See Chapter 3 of this minibook for more information on conducting a web advertising campaign.) If you see specific keywords or phrases in your reports for organic search results, you know that those words are powerful terms that bring people to your site.
 If you’re running a web-marketing campaign, you should distinguish search result referrals from sponsored ad referrals. If you include a keyword at the end of the link you provide for the sponsored ad, the keyword shows up correctly in the referrer file. For example, if you’re linking to your home page and creating a Google AdWords campaign, you can add the link
 www.yourwebsite.com?google to help interpret your results.
You might also see “direct” as a source of traffic, which could be links that come from your website where you’re linking people from one page to another page on your website.
Direct traffic can also mean that users just typed your URL directly into their web browsers or have your website set up as a bookmark in their browsers so that they can go directly to your site. This entry is a good thing to see because it indicates that people are being drawn naturally to your website without having to find it from another website.
Examining viewer behavior
Getting viewers to your website is step 1. Once they arrive to your website, the next question is how they are using the site or which web pages (and how many) they are viewing before they leave the website.
One key metric that you will see with analysis software is something called the bounce rate. The bounce rate (for any given “entry” or starting page on your website) is the percentage of viewers who, after arriving at that given page, leave the website (or “bounce”) without viewing any other pages within that website. This rate is used by many website owners to gauge the effectiveness of their website. After all, if people arrive and immediately go somewhere else without clicking in deeper, that’s a lot of “wasted traffic” that isn’t earning the owner any sales or loyalty from the user.
Bounce rates are not just important for your website’s direct success. Search engines study bounce rates as well, and theorize that, if people arrive at that page and then immediately leave, then the web page isn’t a useful result and will then lower that web page’s ranking within the search results.
Your analysis software, in conjunction with your website software, should be able to track the path that users take when navigating your website. (For example, a path could be when a user arrives at your home page, then clicks on a product page, then clicks on a Buy button, then completes the buy screen and clicks on Order, and then sees the summary/receipt page and clicks away from the website.) If you get an overall view of everyone’s path or “user flow” from page to page, you can begin to detect patterns of viewer usage. More important, you will see where in the path that users leave or bounce from your website, which could indicate to you an area that needs to be revised or improve in order to increase retention and eventually sales.
Google Analytics provides a Behavior Flow report that shows an overall view of people’s paths through your website, as shown in Figure 5-3. One area of interest in these reports is the color extension to the right of a page entry. If you hover your mouse over that area, you’ll see the number of drop-offs (or people leaving) from that page, and the corresponding percentage of those drop-offs to overall traffic.
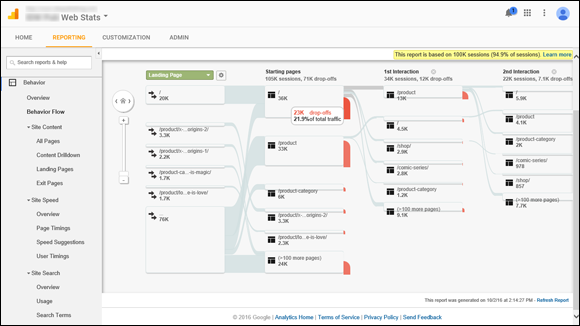
FIGURE 5-3: See how your viewers are navigating your website.
Other statistics to monitor when studying user behavior include:
-
Popular landing pages: Are your visitors starting on your home page, or a specific page within your website? By studying the popular landing pages, you can gain an idea about which pages to optimize and make sure those pages load quickly, are optimized with the right content, and have the correct links to help you generate sales.
 You should also be aware of your most popular exit pages, which represent the point in a customer’s path when the person gives up and goes somewhere else. Sometimes, it’s the final order confirmation screen, which is what you want to see. Most times, however, you see another page, which should encourage you to investigate why that’s the case. Maybe that page gives a negative impression of your website. Perhaps you’re encouraging your customer to check out another website and he or she is following that link rather than continuing with you. A page on your site might contain invalid, outdated, or useless information and links. The report shows you the where, and you need to determine why it’s an exit page.
 -
Site speed: It’s not always whether the web page is correct, but also how fast it loads for the user. In the era of fast connections to the Internet and instant gratification, users want their pages to load and display quickly or they could move onto a competitor. Analytics software helps show you how quickly users got their web pages and how quickly they navigated through the site. If you are noticing a particular web page that is loading more slowly than others (perhaps due to too many images, too many website or database queries, or special technology like Flash or video files), you may consider optimizing or fixing that page to improve loading time.
Site search: No website should be complete without an internal search engine, and keeping track of what keywords your viewers are typing into your own search engine will tell you what products or pages need to be front and center and easily accessible.
Checking abandoned shopping cart logs
Typically, an e-commerce shopping cart creates a text file that contains a customer order. As the customer makes changes to that order, the shopping cart program adds or deletes from the file. When the customer checks out and pays for the order, the shopping cart converts the file into something else and deletes it from memory.
However, numerous studies indicate that website visitors abandon their shopping carts as much as 90 percent of the time. By looking at the shopping cart files that don’t get ordered, you get an idea of how many people start the process but don’t finish. You can compare this number to the number of orders you receive to calculate the percentage of potential customers that complete an order. This is the biggest statistic to help you gauge and improve conversions, or the number of viewers who end up becoming buyers.
Suppose you receive 50 orders for products in a month and then search for your shopping cart files and find 150 that were never processed. Your result means that 200 customers started the process, but only 50 finished, which is a 25 percent completion ratio for your visitors. When you know your ratio, you can start to take steps to improve it; we show you how in the section “Using Your Data to Understand Your Business,” near the end of this chapter.
You can also find out which products are more popular by counting which ones get added to the carts. If someone took the time to physically add a product to his or her shopping cart, there is intent and demand for the item. You can use this information to help guide future product orders.
Measuring traffic against activity
Your website traffic data shows you a lot of information. To give these numbers some perspective so that you can make higher-level decisions, especially when it comes to conversions, you have to match the traffic with other indicators of activity on your website:
- Number of orders
- Average order size
- Number of registered customers (if you offer registration)
- Total sales volume
- Average number of products per order
- Most common search terms (if you have your own site search engine)
The reason to compare these numbers is to give you an idea of how much your traffic is influencing your sales. Suppose that your website gets 1,000 unique visitors one month and you see that you’re getting 250 orders from 200 unique customers that month. Theoretically, if you can double the number of visitors you receive in a month, you should see a similar increase in your orders and unique customers. Perhaps it doesn’t double, but if you can estimate the benefit of bringing in more people, you can estimate the amount of money you can spend to increase traffic.
Putting together all this information gives you a complete picture of how your business is operating. Knowing these factors helps you make dozens of decisions that affect your entire business.
Analyzing Your Traffic Analysis Software
As we mention earlier in this chapter, it’s not recommended that you attempt to manually analyze your website information (from areas like your log files) to get your website statistics. Therefore, we highly recommend using traffic analysis software such as Google Analytics, which you can find at www.google.com/analytics. However, there are varying levels of software available in the marketplace. You can choose from different versions and levels of traffic analysis software: basic, detailed, and enterprise or big business.
Basic analysis software
When you’re using a basic analysis tool, you’re looking for a program to create summaries of traffic information for a given period. Some tools, such as Angelfish Digital Analytics software (analytics.angelfishstats.com), run on your self-hosted server. Others, such as Deep Log Analyzer (www.deep-software.com), Google Analytics (www.google.com/analytics), or Mach5 FastStats Log Analyzer (www.mach5.com/products/analyzer/), present data in both columnar and graphical formats for easy viewing.
Here are some statistics that every program should produce or estimate:
- Total number of visitors and unique visitors
- Average number of daily visitors
- Total and average number of page views
- Total and average number of hits
- Average length of a visit (in minutes or number of page views)
Although the software you use might produce additional results, you can usually count on these categories being calculated. As an example, if you’re using a free tool that creates a text summary and you requested a summary for your October 2016 traffic data, you might see results like this:
Period: Sat-1-Oct-2016 12:00 to Mon-31-Oct-2016 23:59 (31 days).
Total successful requests: 2,221
Average successful requests per day: 72
Total successful requests for pages: 948
Total failed requests: 75
Total redirected requests: 349
Number of distinct files requested: 42
Number of distinct hosts served: 618
Number of new hosts served in last 7 days: 72
Total data transferred: 25,349 kbytes
Average data transferred per day: 844,967 bytes
This data gives you some important numbers for future demand. By looking at the total and average amount of data being transferred, you get an idea of the bandwidth you need to purchase for your website. You can see how many different web pages are being looked at on your site. In this example, 42 different web pages were requested. If your website has only 50 or 60 total pages, your customers are using a wide range of your site. If you have 200 or 300 pages, you need to see which pages are being loaded and figure out what to do with the rest.
You can also see more detailed information with Google Analytics (see Figure 5-4). Google Analytics provides line graphs and summary tables to draw a detailed picture of your website’s usage statistics, broken down by month and arranged by different criteria.
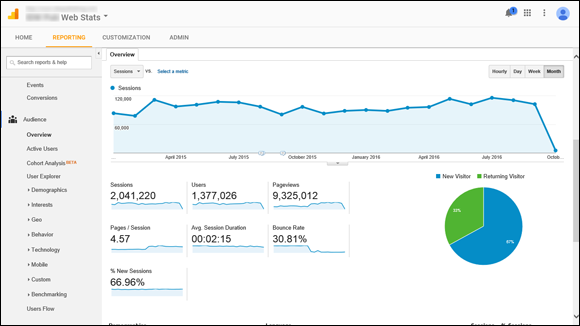
FIGURE 5-4: Look at your website traffic numbers month by month.
Detailed analysis software
At some point, you want to see more advanced information about how your website operates so that you can make targeted changes and updates to improve performance. At this stage, you should look into buying a tool such as WebTrends (www.webtrends.com) or SmarterStats (www.smartertools.com/smarterstats) to analyze your log files and provide more defined criteria, such as
- A detailed breakdown of page views
- The most common referral links used by your visitors
- The pages from which users are most often exiting your site
- The number or percentage of return visitors
- The most popular web browsers used by your visitors
- The most popular search engines that deliver your traffic
- The amount of nonhuman traffic (such as search engine programs)
- The busiest and slowest parts of the day for your web traffic
These tools come with a number of predefined reports that help you understand your visitors’ and customers’ sophisticated interaction with your website. Figure 5-5 shows a report from WebTrends that provides a series of dashboard reports. As you change the dates of the period you want to analyze, the graphs are updated automatically. This way, you can compare traffic levels for different weeks, months, or even seasons.
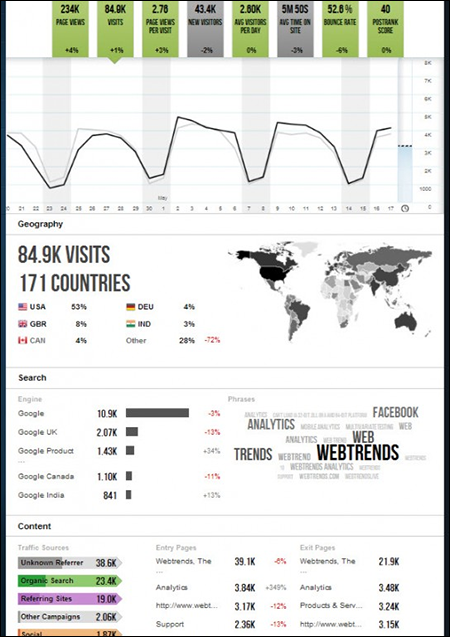
FIGURE 5-5: WebTrends provides a series of reports to understand your website traffic.
Upload your log files or grant access for these analysis software programs to read your log files automatically. You might have to install these programs on your web server to get them to work properly. Follow the setup instructions and talk to your web-hosting provider if you need specific path or filename details.
Enterprise or big business
As your business grows, you might want to move up to an enterprise-level solution, such as one of these programs:
- Adobe Marketing Cloud Analytics:
www.adobe.com/solutions/digital-marketing.html - Hitslink:
www.hitslink.com - IBM Enterprise Marketing Management (formerly Coremetrics):
www.ibm.com/software/marketing-solutions/coremetrics
In this case, you want to install the service on your web host. The key to using these programs is being able to write your own queries to the database, which means that you come up with your own specific requests for summary data.
Some programs require that you know a specific computer language, such as SQL, to create your own reports. If someone in your business is focused on information technology, have that person help you develop the language necessary to build these reports.
Collecting the Correct Information
After people start taking advantage of website traffic analysis, they sometimes fall into the trap of believing that the software does all the work of collecting the right data. You have to realize that although your web server collects some types of information, you can collect other types yourself. In this section, we discuss how you can use your website to reach out and collect more specific information without your customers having to cough up their Social Security numbers.
Storing data using cookies
Any web server can create a standard file on a visitor’s computer, to keep track of that visitor’s activity and interaction with the web server. That file is known as a cookie because it leaves “crumbs” of information that the web server can access when the user visits that website. A cookie is a website owner’s friend in many respects because it can show him or her what an individual user is doing on the site. You can track individual behavior and calculate unique visitors and session length much more precisely than by using log files. You can focus on one user for any length of time, from a few days to a few months, to see what the user does on every visit. You can see which web pages the user looks at and the order of those pages and then correlate that information to the user’s orders and sign-up activity.
Cookies help move your focus from a site-specific level to a customer level. When you add cookies to your server log files, you can gauge the efficiency of your marketing campaigns with precision. You can judge for yourself how effective your campaigns are so that you’re not relying solely on your advertiser reports.
To turn on the use of cookies, ask your web-hosting provider to enable them for your web server. After you do that, tell your provider which basic fields you want to use and capture in your cookies, such as
- The visitor’s IP address
- The visitor’s username or account name
- The date and time of the visits
Your customers can refuse to have cookies stored on their computers, or they might use public computers, so their cookies won’t be consistent. Even if you don’t get a 100 percent view of your traffic, using cookies is much more precise than just analyzing your log files.
After you enable cookies on your web server, your last step is to ensure that your traffic analysis software can access the cookies that your web server leaves. That way, the software can incorporate that information into its reports and update its figures accordingly.
Adding information to your links
When you’re looking at your log files, you see keywords in the string that represent a referral URL. Sometimes, these keywords are search terms used by visitors when they’re using search engines. At other times, however, those specific terms were created for the purpose of communicating information.
You can tag, or add keywords to, your URL to track the success of a marketing campaign. For example, you can tag your URL differently for your Facebook post, a specific tweet, an e-mail newsletter, and other marketing materials to judge the efficiency and reach of each announcement separately. Add the keywords after the name of the HTML file by typing a question mark (?) and then the keywords, like this:
<a href="http://www.yourwebsite.com/index.html?GoogleAd1">
This way, when someone uses your targeted URL, the traffic analysis software can determine the number of times the keyword (GoogleAd1, in this example) was sent in the URL as a percentage of the total number of requests and then calculate a percentage.
If you continue to include this keyword throughout the ordering process, your analysis software can determine the conversion rate of browsers to buyers by studying how many buyers used a keyword as a percentage of the number of the browsers who came to your website.
Studying the path analysis
Your customers eventually follow a path of specific web pages that take them from start to finish on your site. Although individual customers might check out different parts of your website along the way, they need to visit a minimum number of web pages to go from a browsing customer to a paid customer. This minimum number of pages is sometimes called the critical path of your website.
Suppose that your website targets different levels of customers and has a special section for small-business customers. Your critical path might look like this:
Home page → Small-business home page → Small-business catalog page → Order review page → Order checkout page
When you identify the critical path for your customers, you can combine this knowledge with the traffic analysis you already completed to determine when and where people are dropping out of the order process. If you improve this process for your users, you should see an increased number of completed orders and a decreased number of abandoned shopping carts.
Suppose that you’re studying the order checkout path. Here are some ways you can integrate all your research:
- If your report of the most common exit pages shows the order review page as a common exit page, something in the order review process might be confusing or counterintuitive to your users.
- If your referrer file indicates that a number of people are jumping to your frequently asked questions (FAQs) page or privacy policy page from your order review page, your customers most likely need or want more information before they check out. When they jump out of the critical path, a percentage of them never come back to the review or checkout phase. Therefore, you can integrate some of this content into your order review page and see whether fewer people exit before completing the review page.
- An order checkout page that involves multiple steps and shows people linking back and forth to the same pages could indicate that users are caught in a loop and can’t break out to finish their orders. You might need to combine certain steps on one page or provide more clearly labeled links to convince customers to move forward.
Besides keeping your customers from dropping out of the order process, the other reason for studying your paths is to help you decide to redesign your website. Your customers eventually make their own path through your website, despite any warnings or guidelines you post. You can either continue to try to steer those customers or study their paths and incorporate that information into your site design so that the most common paths are recognized and supported by your website links and structure.
Just as a river cuts its own path through the countryside, your customers will cut their own path through your website. You should always support that path and optimize your site around it rather than fight it and prevent customers from moving around the way they want.
Getting to Know Your Customer
If you’ve ever walked into a store to buy batteries, you know that the store wants to know a lot about you. The clerk might ask for your zip code, and sometimes your address, even if you’re paying cash. The people who run the company do this so that they can get an understanding of the customers who walk through their door and how those customers shop. Although you may find this process annoying or off-putting, you probably accommodate the request. The store can then accurately predict, for example, which customers from which zip codes will order the most batteries.
Gathering customer information is a delicate but ultimately profitable venture because analyzing that information gives you razorlike focus on how your customers interact with you. Just like supermarkets that encourage their customers to use loyalty cards when they shop, websites are now gathering information on a customer level, independent of the traffic information that their web browser leaves with your website. Because the customer is now signed in to the website, every activity is recorded and assigned to a customer account, which can be analyzed and aggregated without worrying about issues such as IP addresses and cookies.
As you understand your individual customers better, you move the focus of your data from your overall website statistics to your customers, where the common factor isn’t your entire website but rather the average customer and what he or she does on your website. Begin by having your traffic analysis program identify a unique visitor and then summarize information, such as average length of a visit or session.
Your goal is to find customer-specific patterns, not overall site trends. Collect data from your customer interactions that allow you to gain insight into customers’ browsing and buying behavior. At this point, you should add tags or information on pages that matter to your customers, whether it’s the order process screen or customer login screen.
Your existing customers have already told you a lot about themselves, including their
- Names
- Mailing addresses
- Credit card information
- Order lists of products
At some point, consider signing up users when they arrive at your website or want to learn more or do more on your website. Then tie that information into both the traffic and order statistics, to give yourself a true customer focus on your website activity.
When a customer has to log in to your website to use it, you can track every movement and tie those movements to a specific user ID number. Typically, users need some sort of incentive to reveal their personal information and complete a sign-up process. Some websites offer their members exclusive, premium content that casual browsing customers cannot access. Other sites require accounts to be created before products can be added to their shopping carts. You need to determine which special features you want to give to people who sign up with you.
When you use a sign-up process, you lose a certain percentage of browsers who could have become buyers. If you see a big drop-off in activity after instituting a sign-up process, consider assigning a guest account to your procedures. A user who wants to shop can convert a guest account to a permanent account.
Most websites ask for basic information whenever someone signs up for an account:
- User’s name
- Address
- City, state, zip code
- Phone number
- E-mail address
However, if you think beyond these basic fields, you can ask users additional questions to draw a better picture of your customers, and even to gather ideas that can influence your website, such as these examples:
- Demographic information: Gender, ethnicity, age, marital status, kids
- Psychographic information: Likes, brand recognition, purchase reasons
- Lifestyle information: Income, housing status, types of cars
- Interests and preferences: Favorite subjects, products, and people
Use the data to better understand what customers want and to customize content to them. On the survey form shown in Figure 5-6, the company asks about the interests of its potential shoppers based on their recent order.
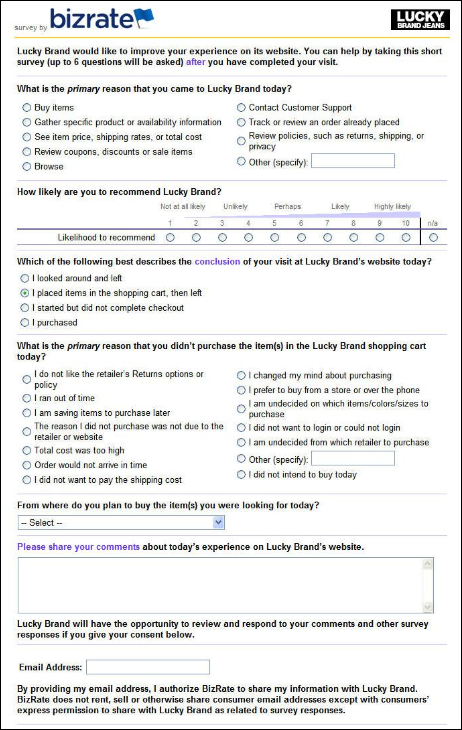
FIGURE 5-6: Ask customers what they like to buy and use that information.
The options you present can be limited if your customers don’t contribute information; if you make it required, however, you can lose a substantial number of potential and actual customers. Make this information-gathering process optional so that customers who don’t want to reveal their information aren’t blocked from using your website.
Using Your Data to Understand Your Business
Collecting your website traffic and usage data is important for understanding your business. The true value of all this collection and analysis becomes evident when you act on the data and implement changes to your site. After all, what good is learning about a problem if you don’t correct it?
Watching trends to find out average behavior
After you set up and collect your data, you have to monitor the activity levels to see trends and behavior so that you have a benchmark for comparison when you’re ready to make changes. After all, if you don’t know the average behavior of your website, you don’t know where it has room for improvement.
When you study traffic and usage patterns for a longer period, look for any big changes in the data. If you see that your traffic suddenly experienced a big increase or suffered a huge drop, ask yourself what is causing big spikes or drops in your activity. Determine whether they’re related to a change you made (such as an ad campaign), overall traffic, or a random event.
To fully investigate, create or access reports that give you detailed information from around the time of the change. This way, you can hunt down big problems quickly. If the number of orders decreased and the number of error-log entries about pages not being delivered correctly increased, you know that your web server or Internet service provider was experiencing outages. If your website was unexpectedly mentioned as part of a big news article, you probably saw a spike in visitors to your site and (you hope) a spike in the number of orders placed on your site.
Other problems are less obvious to identify. Diagnosing these situations involves looking at web page activity and seeing which statistics have been affected by the change in activity. As you look at your site, be aware of any changes you made to the web pages, however big or small, and see whether the dates of those changes match up with the change in usage. Sometimes, a simple change disrupts an otherwise stable process and causes unexpected problems. If you watch trends, however, you can spot problems early and then fix them.
Identifying areas of improvement
You have many ways to know when something needs updating. When your car bounces over a pothole and says “ka-thunk,” you know that it’s time to repave the road. On your website, a report might indicate that traffic took a nosedive. Your e-mail account might be filled with customers screaming IN ALL CAPS that you can’t keep operating a certain way.
You can also look at the data you’re collecting to start making predictions before problems get out of hand. Find out which web pages your users
- Gravitate to
- Avoid
- View most often and least often
Sometimes, the problem is a factor that your data can only partially identify. Suppose that your traffic report indicates that people check your website every morning. In addition to having traffic data, you know that your product catalog is updated only at the end of the business day, when you hear back from your suppliers. Put together those two pieces of information, and you have a timing problem because your site isn’t as current as possible when visitors check it out. They might move on if they see you as unresponsive. In this example, you have to figure out a way to update your inventory each morning.
Put yourself in the role of your customer. Start at your home page and try to place an order. Use your traffic and usage data to back up your assumptions about how to proceed. If you find a page frustrating to use and it shows up on your most common exit pages, you’ve identified an area to improve.
Don’t overlook the importance of direct customer feedback for website improvements. Encourage regular dialogue, use follow-up surveys, and stay in contact with a portion of your customers at all times. They’re usually up front about what can be improved and what has to be changed. After they identify a concern, you can research your data to choose your next step.
Deciding on a change
As you look at all your data and trends, identify an area that can be improved. Look at all factors that can influence its poor performance, and choose an element to change on your website that mimics a part of the site that performs well. Look at competitors’ websites to see whether they handle the process differently. Ask customers for feedback on how you should handle the process.
When you’re ready to update a part of your website, follow these steps:
-
Make sure that you have a beginning set of statistics before you implement the change.
You need a set of data specifying how your website operated before the change, to use for later comparison.
-
Make the change on your website.
Many sites post notices about maintenance periods, as shown in Figure 5-7, where their sites are temporarily unavailable while new updates are posted. Typically, these updates take place during the night for U.S. customers so that the updates have the least effect on traffic. Use the maintenance period to send new versions of your web pages to your web server.
- Gather your traffic statistics after the change is posted to your website.
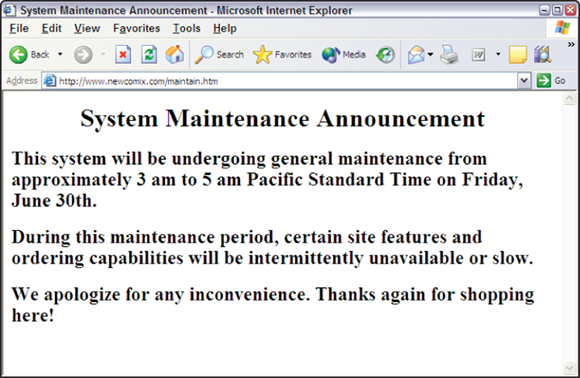
FIGURE 5-7: Use a regularly scheduled maintenance period to make updates to your website.
Watch the usage data after the new version is available, and notice whether traffic went up, as predicted, or down. Notice also whether other parts of your website were affected and whether orders increased.
Following up
Any change to your website can affect all your other processes. Therefore, you must follow up any change you make to your website, to make sure that you haven’t disrupted anything else. You also have to study customer reaction to your changes and make sure that they benefit from them as much as possible.
Sometimes, you need to roll back the change (remove the update or go back to the old process). Although the techniques discussed in this chapter give you lots of insight into customer behavior, traffic analysis doesn’t predict events with 100 percent accuracy. That’s why you must stay flexible and judge whether any updates still provide value after they’re implemented.