Let's get started:
- Log in to the ESXi host using an SSH client (Putty).
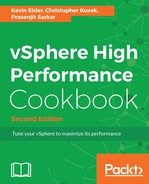
- Run esxtop and monitor the statistics. The following screenshot is an example output:

- Now, look at the performance counters as mentioned previously. In the following example output, look at the different metrics:

In the preceding example, you can see our PCPU 0 and PCPU 1 are being used heavily (100 percent and 73 percent UTIL, respectively), and it shows the following figure:

Now in the preceding example, you see that the %Used value of the four CPU-hungry virtual machines is pretty high.
Also, look at the %RDY screen and you will see high ready time, which indicates a performance problem.
The following list is a quick explanation of each of these metrics:
- PCPU USED (%): This refers to the CPU utilization per physical CPU. %USED: This is the physical CPU usage per group.
- %SYS: This is the VMkernel system's activity time.
- %RDY: This is the ready time. It is referred to as the amount of time that the group spent ready to run but waiting for the CPU to be available. Note that this is not adjusted for the number of vCPUs. You should expand the group to see %Ready for each vCPU, or at least divide this by the number of vCPUs to use an average per vCPU.
- %WAIT: This is the percentage of time spent in the blocked or busy state. It includes idle time and also the time waiting for I/O from the disk or network.
- %CSTP: This is referred to as the percentage of time spent in VMkernel on behalf of the group for processing interrupts.
- %CSTP for a vCPU indicates how much time the vCPU has spent not running in order to allow extra vCPUs in the same VM to catch up. High values suggest that this VM has more vCPUs than it needs and the performance might be suffering.
- %MLMTD: This is the amount of time spent ready to run, but not scheduled because of a CPU limit.