To check memory utilization of a VM, follow the ensuing steps:
- Open up vSphere Web Client.
- Log in to your vCenter Server.
- On the Home screen, select VMs and Templates.
- Choose the VM where you want to monitor the utilization of memory.
- Go to the Monitor tab, then the Performance tab, and then click on Advanced.
- Select Memory from the drop-down list.
- Click on Chart Options.
- Select the Active, Ballooned, Consumed, and Host consumed % counters and click on OK to continue.

The following is an example where you can see the utilization of this VM is almost 96 percent:

Now to check the overall host memory consumption and active host memory consumption, you need to perform the following steps:
- Open up vSphere Web Client.
- Log in to the vCenter Server.
- On the Home screen, select Hosts and Clusters.
- Choose the ESXi host where you want to monitor the memory consumption.
- Go to the Monitor tab, then the Performance tab.
- Select Memory from the drop-down list.
- Click on Chart Options.
- Select the Active, Ballooned, Consumed, and Host consumed % counters and click on OK to continue.
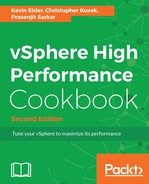
Now let us look at a sample screenshot and see what it looks like:

You can see in this example that we have an ESXi host that has 32 gigabytes of physical memory and we are consuming almost every bit of it.
However, if you look at the Active Memory here, we are using a little under 7 gigabytes. This means that although we have more than 30 gigabytes of Consumed Memory, we only have 7 gigabytes of Active Memory. It should not create many issues. This could indicate overprovisioning of resources; if applicable, VMs should be right-sized by removing the allocated RAM that is not required.