
Regardless of the type of site you’re running, there are many things you can track: the actions visitors took, the experiences they had, how well they were able to use the site, what they hoped to accomplish, and most importantly, whether your business benefited in some way from their visits.
Here’s a quick overview of some of the things you’d like to know, and the tools you’ll use to collect that knowledge.
What we’d like to know | Tool set to use |
|---|---|
How much did visitors benefit my business? | Internal analytics |
Where is my traffic coming from? | External analytics |
What’s working best (and worst)? | Usability testing, A/B testing |
How good is my relationship with my market? | Customer surveys, community monitoring |
How healthy is my infrastructure? | Performance monitoring |
How am I doing against my competitors? | Search, external testing |
Where are my risks? | Search, alerting |
What are people saying about me? | Search, community monitoring |
How are my site and content being used elsewhere? | Search, external analytics |
We’re now going to look at many of the individual metrics you can track on your website. If you’re unfamiliar with how various web monitoring technologies work, you may want to skip to Chapter 4 and treat this chapter as a reference you can return to as you’re defining your web monitoring strategy.
When you first conceived your website, you had a goal in mind for your visitors. Whether that was a purchase, a click on some advertising you showed them, a contribution they made, a successful search result, or a satisfied subscriber, the only thing that really counts now is how well your site helps them accomplish the things you hoped they’d do.
This may sound obvious, but it’s overlooked surprisingly often. Beginner web operators focus on traffic to the site rather than business outcomes of the site.
All sites have some kind of goal, and only a percentage of visitors accomplish that goal. The percentage of visitors that your site converts to contributors, buyers, or users is the most important metric you can track. Analyzing traffic by anything other than these goals and outcomes is misleading and dangerous. Visits mean nothing unless your visitors accomplish the things you want them to.
This is so important, we’ll say it again: analyzing web activity by anything other than outcomes leads to terrible mistakes.
Your site’s ability to make visitors do what you wanted is known as conversion. It’s usually displayed as a funnel, with visitors arriving at the top and proceeding through the stages of a transaction to the bottom, as shown in Figure 3-1.
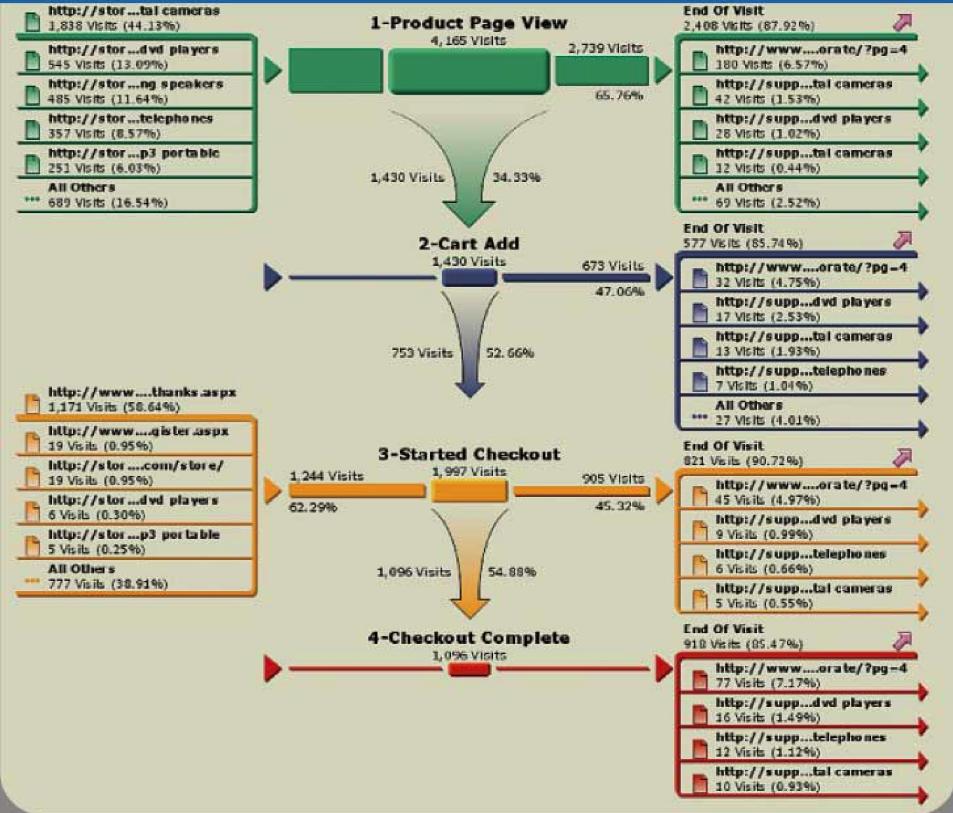
By adjusting your site so that more visitors achieve desired goals—and fewer of them leave along the way—you improve conversion. Only once you know that your site can convert visitors should you invest any effort in driving traffic to it.
What to watch: Conversion rates; pages that visitors abandon most.
Some sites expect people to leave, provided that they’re going to a paying advertiser’s site. That’s how bills get paid. If your site relies on third-party ad injection (such as Google’s AdWords or an ad broker) then click-through data is the metric that directly relates to revenue.
A media site’s revenue stream is a function of click-through rates and the money advertisers pay for those clicks, measured in cost per mil (CPM), the cost for a thousand visitors. Even if the site is showing sponsored advertising (rather than pay-per-click advertising) for a fixed amount each month, it’s important to track click-throughs to prove to sponsors that their money is well spent.
What to watch: The ratio of ads served to ads clicked (click-through ratio); clicks by visitors (to compare to ad network numbers and claims); demographic data and correlation to click-through ratio; and CPM rates from advertisers.
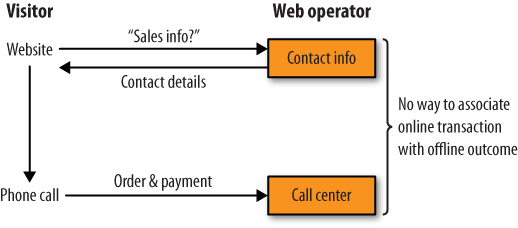
Many actions that start on the Web end elsewhere. These conversions are hard to associate with their ultimate conclusions: the analytics tool can’t see the purchase that started online if it ends in a call center, as shown in Figure 3-2.
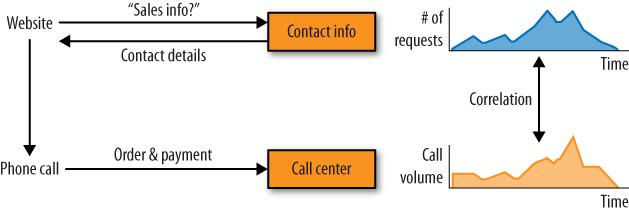
You can, however, still track conversions that end offline to some degree. Provide a dedicated phone number for calls that begin on the website, then measure call center order volumes alongside requests for contact information. You’ll see how much traffic the site is driving to a call center in aggregate, as shown in Figure 3-3.
With a bit more work, you can get a much better idea of offline outcomes. To do this, you’ll need an enterprise-class analytics solution that has centralized data warehousing capabilities. First, provide a unique code to visitors that they can then provide to call center operators in return for a discount, as shown in Figure 3-4. Then use this information to associate calls with web visits.
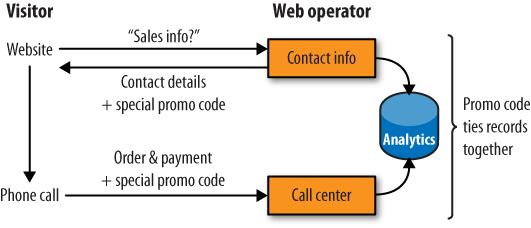
The need to tie visits to outcomes is one reason many companies are deploying web applets that invite visitors to click to chat with sales or support personnel—it’s far easier to track the effectiveness of a website when all the outcomes happen within view of the analytics system.
Real-world beginnings can also lead to online ends, presenting many of the same problems: a tag on a Webkinz toy leads a child to an online portal; an Akoha card prompts someone to create an online account and propagate the card. The postcard pictured in Figure 3-5 contains a unique URL that’s tied to an online marketing campaign, allowing an analytics team to compare the effectiveness of this message to others and to optimize offline campaign components.

Figure 3-5. A postcard for FarmsReach.com to be distributed offline includes a custom URL used to tie the marketing message to an online outcome
Standard analytics tools ignore offline components at the beginning or end of a transaction without additional work. If your business has an offline component, you’re going to need to get your hands on a system that allows you to integrate your data. Until you can get a system that automates this process, expect to spend a lot of time manually consolidating information.
What to watch: Call center statistics by time; call center data combined with analytics records; on-demand chat usage; lead generation sent to CRM (Customer Relationship Management) applications.
If your site thrives on user-generated content (UGC), contribution is key. You need to know how many people are adding to the site, either as editors or commenters, and whether your contributors are creating the content that your audience wants.
UGC contribution can be thought of as the ratio of media consumed to media created. It takes three major forms: new content, editing, and responses. All three are vital to a dynamic site, but too much or too little of any of them can be a bad sign.
Too many comments are telltale signs of vitriol and infighting that distracts from the main post and discourages more casual visitors.
Too much new content from a few users suggests spamming or scripting.
Frequent editing of a single item may signal partisan disagreements.
If you’re running a collaborative site, you care about how valuable new content is. Many of the metrics you’ll track depend on the platform you’re using. For example, if you’re running a wiki, you care about incipient links (the links within a wiki entry that point to another, as-yet-unwritten, entry).
If an entry has no incipient links, it’s orphaned and not well integrated into the rest of the site. On the other hand, if it has many incipient links that haven’t yet been completed, the site isn’t generating new content quickly enough. Finally, when many people click on a particular incipient link only to find that the destination page doesn’t yet exist that’s probably the page you should write next.
We’ll return to specific metrics for various kinds of community sites in the community monitoring section of the book.
What to watch: Read-to-post ratio; difference between “average” and “super” users; patterns of down-voting and “burying” new posts; high concentrations of a few frequent contributors; content with high comment or edit rates; incipient link concentration; “sentiment” in the form of brand-specific comments or blog responses.
Some media sites offer premium subscriptions that give paying customers more storage, downloadable content, better bandwidth, and so on. This can be the main revenue source for analyst firms, writers, and large media content sites such as independent video producers.
Additional bandwidth costs money, so subscriptions need to be monitored for cost to ensure that the premium service contributes to the business as a whole. For example, if users get high-bandwidth game downloads, how much traffic are they consuming? If they buy content through PayPal, what’s the charge for payment? In these situations, analytics becomes a form of accounting, and you may need to collect information from networking equipment such as gigabytes of traffic delivered.
What to watch: Subscription enrollment monitored as a transaction goal; subscription resource usage such as bandwidth or storage costs.
If you’re running a subscription website—such as a SaaS application—then your subscribers pay a recurring fee to use the application. This is commonly billed per month, and may be paid for by the individual user or as a part of a wider subscription from an employer.
It’s essential to track billing and account use, not only because it shows your revenues, but also because it can pinpoint users who are unlikely to renew. You’ll need to define what constitutes an “active” user, and watch how many of your users are no longer active. You’ll also want to watch the rate of nonrenewal to measure churn.
Small business invoicing outfit Freshbooks lets users invoice only a few customers for free; automated video production service Animoto limits the length of video clips it generates for free; and picture site Flickr constrains the volume of uploads in a month. This “velvet rope” pricing strategy encourages users to upgrade to the paid service. If you take this approach, treat the act of converting free users to paying users as a conversion process in a transactional site.
What to watch: Monthly revenue, number of paying subscribers; “active” versus “idle” users; volume of incidents per subscriber company; churn (nonrenewal) versus new enrollments.