
Having information on every user’s visit is tremendously useful, both for troubleshooting individual incidents and for determining whether your website is living up to its promises.
When deploying a RUM tool, your first decision is how to collect all this data. Your approach to collection significantly affects what you can do with your RUM solution, and there are advantages and disadvantages to each approach.
We’ve seen that there are two major ways of collecting data: on the server side and on the client side. Server-side collection approaches include server logging, reverse proxies, and inline sniffers or passive analyzers. Client-side collection approaches include desktop agents and JavaScript instrumentation in the browser.
Much of this collection technology resembles the monitoring approaches we looked at for a web analytics implementation, but it’s focused more on performance measurement. Consequently, passive analysis approaches are more common in RUM than they are in web analytics because they can collect network timing information and detect failed requests.
Web server logs give you only basic information about visitor performance. You’ll have the timestamps at which each object was requested, and basic data like what was requested.
You may have more advanced logging, either through specialized software or within the application server. This can tell you about key milestones of an object request, such as when the request was received, when the server responded, and when the server was finished sending the object.
A logging agent sits between the server’s operating system and the application container. Some open source RUM tools, such as Glassbox, track each call to a Java Virtual Machine (JVM) and can provide a detailed hierarchical analysis of an application call to see exactly which function had problems, or to determine which database table caused a slowdown.
Server-side RUM tools like Symphoniq, which also rely on client-side JavaScript, can correlate end user experience with platform health, which allows them to span the gap between IT operations and end user experience.
Logging agents on application servers can time requests to the application from the network, as well as database requests or other backend transactions. Most server agents are more focused on the performance of the application tier (breaking down delay by component or query) than they are on reassembling a user’s session and overall experience.
Logging is essential for application administrators, and forensic analysts may require logging to detect fraud or reproduce incidents. But it’s not a popular indicator of end user experience unless it’s combined with a client-side monitoring approach.
Here are some of the advantages of using server logging:
It runs on the server.
It can capture server health data (CPU, number of threads, memory, storage, etc.).
It can get granular information on transactions within the application container/JVM.
It can include backend transaction latency (such as database calls).
However, server logging has some important limitations:
It consumes server resources.
Aggregating logfiles across servers is always problematic.
A single visitor may hit multiple servers, making records incomplete.
Servers have limited visibility into WAN health since they’re behind load balancers.
You can’t see the ultimate rendering of the page that the end user sees.
It doesn’t see CDN performance.
It can’t measure mashups.
When the server’s down, so are the logfiles that could otherwise tell you what broke.
Reverse proxy servers are located between the web server and the client and can be used to monitor end user experience. While this approach has fallen out of favor in recent years because it adds a point of failure to infrastructure, many load balancers behave much like reverse proxies and may have a role to play in performance monitoring.
A reverse proxy server terminates client requests and forwards them on to servers. Similarly, it terminates server responses and sends them to the client. It may respond to some requests, such as those for static images, on its own to offload work from the servers. Because it’s terminating connections, it is also the endpoint for SSL encryption, so it may have access to data in plain text that is encrypted on the wire.
The result of reverse proxy data collection is a log of HTTP requests that resembles that of a web server, although some proxy servers offer more granular information that yields better visualization and analysis.
Reverse proxy servers that record timings track milestones in a connection. The incoming request from the client, the status code response from the server, the first byte of the object the server sends, and the end of object delivery are used to calculate the performance of a page.
Because a reverse proxy is between the client and the server, it can measure the network health and performance of both ends of a connection. In other words, it may have two sets of TCP round-trip time information, one representing the Internet connection to the client and one representing the LAN connection to the server.
Reverse proxies are servers in the middle of a connection. Unless they have to be there, they’re probably another point of failure and delay for you to worry about. If you have a load balancer with logging capabilities, however, this may be an option you can use.
Reverse proxy collection provides the following advantages:
It sits in the middle of the connection, so it sees both perspectives.
If the proxy is already terminating SSL, it may simplify the monitoring of encrypted traffic.
It may already be in place as a load balancer.
It may be able to inject JavaScript, simplifying client-side instrumentation.
Some of the disadvantages of using a reverse proxy include:
It introduces an additional single point of failure.
It may introduce delay.
It can’t see the ultimate rendering of the page to the end user.
It doesn’t see CDN performance.
It can’t measure mashups.
It may be a point of attack or vulnerability, and represents one more server to worry about.
It’s difficult to diagnose problems when the proxy is the cause.
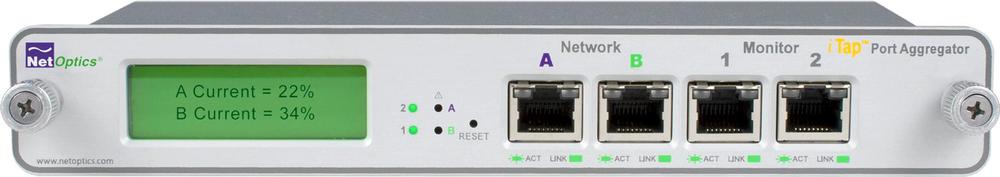
While reverse proxies actually intercept and retransmit packets across a network, there’s another way to sit between the browser and the web server that doesn’t interfere with the packets themselves: sniffing. This approach uses either a dedicated device (a tap, shown in Figure 10-8) or a spare port on a network switch (known as a SPAN port or mirror port) that makes a copy of every packet that passes through it.
Collectively, these approaches are known as inline capture or passive analysis.
Sniffing traffic is a common practice for networking professionals. They rely on sniffers to detect virus traffic, even when there’s no trace of an infection on a server. They use them to pinpoint Ethernet issues or to figure out which applications are running on a LAN. In fact, they use them anywhere they need to know what’s really going on across a network connection.
In recent years, they’re using enhanced versions of sniffing technology to measure end user experience. This approach, called inline RUM, is sometimes referred to as passive analysis because the monitoring doesn’t generate any additional traffic on the network (as opposed to a synthetic monitoring approach, which is “active” because it generates traffic).
A tap or a mirror port copies traffic indiscriminately—every packet on the active network that’s tapped is copied onto the monitoring connection. This means any inline RUM solution has to be good at blocking out nonweb traffic and at reassembling individual packets into web pages at wire speeds.
To capture per-session timing, the device watches for important milestones—the start of a page request, the delivery of the last object, and so on—and uses timers and TCP/IP sequence number information to calculate latency. Because the device can see when packets arrive at and leave the server, it can measure extremely precisely. In fact, some inline RUM tools aimed at the financial industry such as SeaNet (www.seanet-tech.com) can report trade notification timings to the microsecond.
Inline RUM is precise and powerful, and sees problems even when the servers are broken or the pages aren’t loaded in a browser. It can also be expensive—we’re talking about network equipment, after all—and you probably won’t be able to use it if you don’t own your own hardware, because you’re hosted by someone else or running your application in a cloud environment. It also doesn’t see the end user’s ultimate experience, because it’s not on the browser itself.
Inline devices provide the following benefits:
They don’t lie: what you see on the wire is what happened.
They are transparent, so there is no load on clients or servers.
They do not present a point of failure in the network.
You can upgrade and modify them without a maintenance window.
They see performance even when the web page doesn’t load.
They work for any HTTP request, even when JavaScript isn’t executing (mobile devices, RSS feeds, RESTful APIs, etc.).
Of course, inline capture devices have some important shortcomings:
They are more expensive than other options.
They require physical deployment in a network you control.
They can’t see the ultimate rendering of the page to the end user.
They don’t see CDN performance.
They can’t measure mashups.
They have a hard time reassembling pages when the page contains RIA components such as AJAX or Flash, which may make additional HTTP requests at any time.
They capture huge amounts of data, so storage may be an issue.
They require a copy of the SSL key when sniffing encrypted traffic.
You must ensure that security and compliance officers are OK with deployment because you’re collecting data that is potentially sensitive.
One way to collect end user experience data is to put an agent on the user’s desktop. This agent can see every aspect of application use, not just for the web application, but also for other applications. Want to know if the user’s playing Minesweeper while she’s on your site? Client agents will tell you. They’ve got access to the client’s operating system, too, so agents know how healthy the network is and how much CPU resources are being used.
Unfortunately, you probably can’t use them.
Agents are software applications installed on client desktops. They’re used almost exclusively in enterprise applications, where they’re part of company-wide management platforms that handle everything from antivirus updates to backup systems. They sit between the operating system and the applications, watching traffic between those applications and the operating system’s resources.
Aternity, for example, makes desktop agents that track traffic flows to and from applications and that summarize the data and look for exceptions before sending performance metrics back to a management console.
Agents see messages flowing in and out of applications. They can watch for specific strings or for operating system events (such as a window opening or a mouse click). They can also watch for network events like a new DNS lookup or an outbound HTTP request. Agents keep track of the timing of these events, as well as key operating system metrics.
Agents see everything, but you need to own the desktop to install them. If you are able to make use of agents, you can take advantage of the following:
They provide the best visibility into what the user is really doing.
They can see system health information (CPU, memory).
Much of the instrumentation work is done by the client, so this approach scales well as the number of users grows.
Agents have the following disadvantages:
To use them, you will require access to the end user’s desktop, so they are a nonstarter for most Internet-facing web applications.
They cannot see the network outside the end user LAN segment, so IP addressing, packet loss, etc., may be incorrect.
They require different software for different operating systems (Linux, Windows, OS X, etc.).
They slow down the client.
Agents must be maintained by IT.
JavaScript changed the web analytics industry, and now it’s transforming RUM. JavaScript-based monitoring sees what the user sees. This means it has a better view than any other web monitoring technology into the final assembly of the page, which may include client-side logic, plug-ins, and so on. It’s the only way to capture the performance of mashups and third-party content.
What’s more, JavaScript code can access everything the browser knows about the session and the user. This includes data such as cookies stored from previous visits or data on the number and size of browser windows. You can use this information to augment user performance with business and visitor context.
JavaScript RUM begins with page instrumentation, just as web analytics does. You insert a snippet of JavaScript into your web pages or use an inline device like a load balancer to inject the snippet into pages as they’re served. Either way, the visitor downloads a monitoring script that runs on the client.
The script records milestones of page arrival, and then sends performance metrics to a collector—a third-party service, a server, or the inline device that injected the script initially. To do this, the script requests a small image and appends the message it wants to send to the collector as a series of parameters to the URL. This is similar to JavaScript used for web analytics; in this case, however, the message’s parameters contain performance and availability information.
Imagine that you’re using performance monitoring service Example.com. Your JavaScript watches the page load, and at the end it determines that there were eight objects on the page and that it took 3.5 seconds (3,500 milliseconds) to load.
It then sends a request similar to the following:
http://www.example.com/beacon.gif?loadtime=3500&objectcount=8
The monitoring script doesn’t care about a response—the use of a tiny image is intended to make the response as small as possible. The RUM system now knows that a page loaded, that it had eight objects, and that it and took 3.5 seconds.
The rest of the work, such as reporting, aggregation, and data storage, happens on the RUM service or appliance that received the request for the small object.
Recall from our earlier discussion in Chapter 5 that JavaScript is an event-driven language. To instrument a page as it loads, a monitoring script starts a timer and marks off the moments when important events occur. The first important event is the moment the page loads, and to capture this, the first part of the script appears right at the top of the page. This is the “first byte” time.
As the page loads, the browser generates other events, such as
the onLoad event, which signifies
that all objects have loaded. Simply by knowing the time the page
started and ended, we can determine a useful performance
measurement—how long the page took to deliver, otherwise known as
network time.
Most JavaScript measurement happens in a similar fashion. Using the system’s time (known as epochtime), measurements are determined by calculating the elapsed time between two events.
There’s a problem, however. JavaScript is page-specific. When you load a new page, you load new JavaScript. There’s no way to start a timer on page A (when the user clicks a link) and then stop the timer on page B (when the page loads), because everything related to page A ends when page B is loaded in its place.
There are good security reasons for this. If JavaScript didn’t work this way, someone who’d instrumented site A with analytics could watch everything users did for the rest of their online time, even after leaving site A. This feature of JavaScript provides security and privacy to web users at the expense of being able to monitor their page performance.
Fortunately, developers have a way around the problem that
doesn’t undermine security. When a user is about to leave page A in a
visit, the browser fires an event (onBeforeUnload) telling JavaScript that it’s
about to get rid of the current page and load a new one. JavaScript
stores the current epochtime in a cookie, which is then available for
the newly loaded JavaScript on page B.
JavaScript uses a cookie to store the time at which the user clicked the link. The script on page A effectively passes that start time to the script on page B, where it can be used to calculate the elapsed time—how long it took the server to receive and respond to the click that launched page B.
Despite its appeal, JavaScript still has many problems. Timing through JavaScript is more complex than for other collection models that time things independently of page loads, because the JavaScript that monitors performance is itself part of the page being monitored.
A recent initiative, called Episodes, addresses several of these problems.
JavaScript sees everything from a user’s perspective—when it’s loaded properly—including third-party content and mashups. However, implementing it is usually vendor-specific, making switching services difficult. Furthermore, JavaScript can’t see outside the browser’s sandbox.
The following are advantages to using JavaScript:
It sees all objects from all locations, so it’s good for mashups and sites coming from CDNs.
It sees client-side delay, so it knows when scripts or plug-ins are causing problems, and it measures “perceived render time.”
It knows exactly what the components of a page are.
It can instrument user actions (clicking play on a video, for example) and make them part of the timing.
It works in cloud computing and managed hosting environments because there’s no need for access to servers and no hardware to install.
JavaScript still has some key limitations, however:
If the JavaScript isn’t loaded, you don’t get any data, so it’s not good for diagnosing problems.
Power users may skip a page before JavaScript can run, resulting in gaps in monitoring.
Using JavaScript increases page size and delay.
It doesn’t work for documents (PDF), RSS feeds, some mobile devices, or anywhere that there’s no JavaScript being executed.
Additional coding is required to instrument events beyond those in the DOM.
It can’t see anything outside the browser sandbox (TCP round-trip time, out-of-order segments, public IP address, etc.).
It can’t measure the server delay on the very first page of a visit because it lacks a timer from the previous page—there is no “previous page.”
It must be maintained along with other software within the web page, and is subject to release cycles and QA.
It may introduce some privacy concerns, similar to web analytics, causing users to block third-party scripts.
An effort by Steve Souders of Google (and the author of YSlow while at Yahoo!) may address the just described issues and give us an industry-wide approach to performance monitoring for rich Internet applications.
To understand Episodes, let’s first look at the limitations of JavaScript monitoring today.
- onLoad is not a reliable indicator of page load time
Many applications aren’t ready for the user at precisely the moment the browser’s onLoad event occurs. Some are ready before the onLoad event because they’ve carefully loaded what users need first. Others have additional code to execute before pages are truly complete and ready for users. In both of these cases, we require a way to report a “truly ready” event.
- No standardization of important milestones
Browsers support a limited number of timing milestones. Modern websites have unique milestones, such as the moment when video starts playing. Coders must write code to generate their own timing data to mark these milestones, so there isn’t an easy way to compare the performance of two sites. The result is many proprietary definitions of timing. There’s also no consistent way to track timing of the user’s click on the preceding page, forcing coders to resort to cookies to store click time.
- What is monitored and how it’s collected are intertwined
This is by far the biggest problem with JavaScript-based RUM today, and it’s the one Episodes fixes most cleanly.
In Chapter 6 we saw how stylesheets separate web design from content, making it easier for a designer to change the color of a heading across an entire site with just a single stylesheet change. Stylesheets are an example of specialization in web design: developers can code the application and make it visually appealing, while authors can focus on content.
A similar problem exists with proprietary RUM approaches. The person who builds the application is not the person who’s in charge of monitoring it. The developer knows which important milestones exist in the page—the rendering of a table, the loading of a video, or small messages back to the server. At the same time, the person monitoring the application knows what he wants to watch.
Unfortunately, to monitor an application with JavaScript today, many developers are forced to design not only what is monitored, but also how it’s reported back to a service for analysis. The timing of the page, the metrics to report, and the mechanism for reporting them are all intertwined in much the way content and formatting were with HTML in the early years of the Web. As Steve Souders says (http://stevesouders.com/episodes/paper.php), “There are drawbacks to the programmatic scripting approach. It needs to be implemented.... The switching cost is high. Actually embedding the framework may increase the page size to the point that it has a detrimental effect on performance. And programmatic scripting isn’t a viable solution for measuring competitors.”
Episodes does for EUEM what stylesheets did for web design: it provides a model in which the developer defines milestones and measurements, but one in which those measurements can be collected independently by someone in charge of operations and monitoring.
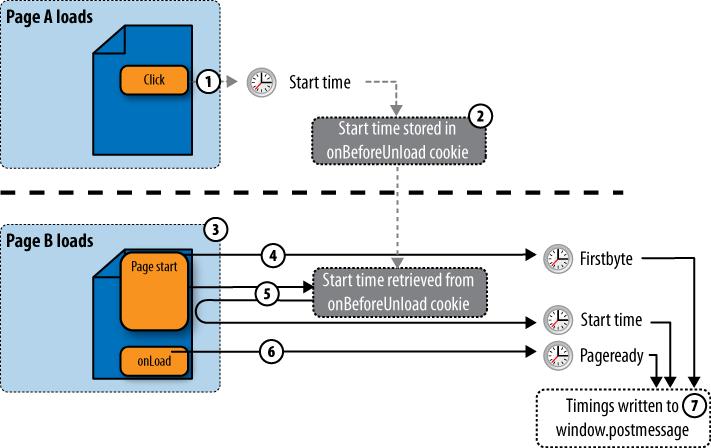
Figure 10-9 shows
how Episodes works, particularly Steve Souders’ episodes.js reference application.
Monitoring of a page’s performance begins when the visitor leaves page A.
The monitoring script records the current time (Starttime) when the visitor clicks a link.
Starttime is stored in a cookie on the browser.
When page B loads, it includes a script near the start of the page.
That script records the current time as soon as it runs (which approximates the first byte of the page) in the DOM (in
window.postmessage), calling it “Firstbyte.”The script also retrieves the Starttime left by the previous page from the locally stored cookie.
At the end of the page (the
onLoadevent) it records the Pageready timing. It may also record custom events the application developer wants to track (such as the start of a video). By measuring the elapsed time between these milestones, other timings (such as server time and network time) can also be calculated.All of this information is stored in
window.postmessage, where any other tool can receive it.
A browser plug-in could read the contents of that space and display information on timings. A synthetic testing site could grab those timings through browser puppetry and include them in a report. And a JavaScript-based RUM solution could extract the data as a string and send it back to a RUM service.
Where Episodes really shines, however, is in operational efficiency. So far, the developer has simply recorded important milestones about the page’s loading in a common area. If the page changes, the developer can just move the snippets of code that generate Episodes milestones accordingly. If new functions (such as the loading of a video) need to be measured, the developer can publish these new milestones to the common area.
As a result, switching RUM service providers is trivial—just change the script that assembles the milestones and sends them to the RUM service. There’s no need to change the way developers mark up the events on the pages. In the same way CSS separates the page’s meaning from its formatting, Episodes changes the page’s functional timings from the way in which they are collected and reported.
Episodes proposes several standard names and timings, as shown in Table 10-1.
Table 10-1. Episodes names and timings
Metric | What it is | How it’s calculated |
|---|---|---|
Starttime | The moment the previous page unloads (approximates a user’s click) | Stored in the onBeforeUnload cookie by the preceding page’s JavaScript and retrieved by the current page’s script when loaded |
Firstbyte | The moment the content is received from the server | Measured when the browser executes an Episodes message near the top of the page |
Frontend | The time it takes for the browser to get the page prepared once a server response has been received | Pageready – firstbyte |
Backend | The time it takes the server to prepare and send the content | Firstbyte – starttime |
Pageready | The moment at which the page is ready for the user | Browser’s |
Totaltime | The total time it takes a page to load | Pageready – starttime |
You can calculate custom timings from new milestones and these default ones.
So what’s the right approach for collection?
A combination of inline monitoring and a JavaScript-based programmatic script that’s compatible with the Episodes approach is the right choice for RUM. The inline device has the most visibility into what is really happening, even when pages aren’t loaded or servers aren’t working, and is invaluable for troubleshooting. The JavaScript approach shows client-side activity, as well as mashups, CDN delivery, and third-party content that closely mimics end user experience. Together, they’re unbeatable.