
Web analytics is your best insight into your website, your brand, and your customers online. But if the site’s not working properly, there simply won’t be any activity to watch. Sites that aren’t reachable can’t sell things, and slow sites lose users. Google estimates that for every additional 500 milliseconds of delay, their site loses 20% of their traffic (http://web2.sys-con.com/node/804850).
Web applications break in strange and wonderful ways, many of which are beyond your control. Monitoring performance and uptime is usually the job of a web operations team, and it’s usually an IT function. And that’s the start of the problem.
In most companies, the skills needed to run a website are often broken up into distinct silos. One group is responsible for designing the application, another for testing it, another for managing the platforms and infrastructure, another for analyzing what happens on it, and another for understanding how web activity relates to community opinion.
This separation of roles might make sense on an organizational chart, but for web applications, it’s dysfunctional. Web analytics and web performance are two sides of the same coin. They should be in the same business unit and should be judged by metrics like user satisfaction, conversion rates, and uptime. The teams responsible for the website’s design, analytics, community, and support need to work alongside the web operations teams that are responsible for making sure the infrastructure, servers, and networks are healthy.
Web operators rely on two main types of tools to make sure their sites are functioning properly. The first, called synthetic testing, simulates visitor requests at regular intervals to make sure the website is working. The second, real user monitoring (RUM), analyzes actual user traffic to measure responsiveness and detect errors.
A visitor’s experience is the performance, availability, and correctness of the site they visit. For the purpose of this book, we’ll define it as a measure of how accurately a user’s visit reflects the visit its designers intended. We refer to the task of managing this experience as End User Experience Management, or EUEM.
In this book, we make the distinction between EUEM and usability. Usability, which we measure with WIA and usability testing, looks at how users tried to use the site. If visitors did something wrong—if they couldn’t find a particular button, or if they entered their hat size in the price field—they weren’t doing something the designers intended. While that issue is, of course, vitally important to web operators, it’s a usability problem.
Here, we’re concerned with how well the website delivers the experience the designers intended. Problems may include pages that took a long time to reach a visitor or rendered too slowly in the visitor’s browser, websites that broke because third-party components or plug-ins didn’t work, and content that wasn’t correct or wasn’t shown on the screen properly.
At its simplest, EUEM is about answering the question, “Is this site down, or is it just me?” Every site operator has experienced a moment of sudden dread when they try to visit their own site and find that it’s not working. If you implement EUEM correctly, you’ll know as soon as there’s a problem, and you’ll know who’s affected.
Before we get further in this discussion, we need to talk about standards. The IT Information Library (ITIL) is a set of recommendations and best practices for operating IT services (www.tso.co.uk). It includes a dauntingly comprehensive set of processes and terms, but its fundamental message is simple and straightforward: any IT service exists to perform a business function.
ITIL is all about running IT as a service. If you’re in web operations, your “customers” are really the rest of the business, and you’re doing your job when the services the business needs are available as expected.
Terms like “performance” and “availability” have many meanings to many people. ITIL defines availability as “the ability of a service to perform its agreed function when required, as a function of reliability, maintainability, serviceability, performance, and security.” In other words, availability is the percent of the time that you did what you said you would.
Availability decreases when the service you run—in this case, a website—isn’t working properly. That may be because of an incident, which is “an unplanned interruption to an IT service” or “a reduction in the quality of an IT service.” It may also be because the site is slow. Slowness simply means that the response time—the time taken to complete an operation or transaction—exceeds an agreed-upon threshold.
Other factors, such as a security breach or an inability to update the site, all affect the availability of an IT service. In this book, we’re going to focus primarily on what ITIL calls Response Time and Incident Management, both of which affect the availability of the web service. For web operators, the task of “day-to-day capacity management activities, including threshold detection, performance analysis and tuning, and implementing changes related to performance and capacity” is called performance management.
Though ITIL makes good sense, it’s a bit formal for many startups that are focused on delivering products to markets before their funding runs out. If you’re looking for something a bit less intimidating, consider Apdex (Application Performance Index), which is a formula for scoring application performance and availability that’s surprisingly simple, and can be used for comparison purposes.
Originally conceived by Peter Sevcik, Apdex is now an industry initiative supported by several vendors. An Apdex score for an online application is a measurement of how often the application’s performance and availability is acceptable.
Here’s how it works: every transaction in an application (such as the delivery of a page to a browser) has a performance goal, such as, “This page should load in two seconds.” Every page load is then scored against this goal. If the page is delivered within the goal, the visitor was “satisfied.” If the page was delivered up to four times slower than the goal, the visitor was “tolerating.” If it took more than four times longer—or simply wasn’t delivered at all because of an error—the visitor was “frustrated.”
To calculate an Apdex score, you use a simple formula, shown in Figure 8-1.
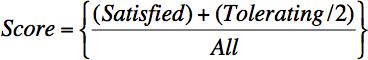
In other words, you add up all the satisfied measurements, 50% of all the tolerating measurements, and 0% of all the frustrated ones, then divide by the total number of measurements.
Note
http://www.apdex.org/overview.html has information on how to calculate an Apdex score, as well as vendors who support the metric. One of its key strengths is the ability to “roll up” scores across many different sites, pages, and applications to communicate performance and availability at different levels of an organization.
Apdex is useful for several reasons. You can take several Apdex scores for different pages or functions on a website, and roll them up into a total score, while retaining individual “satisfied” thresholds. It’s also a consistent way to score a site’s health, whether you have only a few measurements—a test every five minutes, for example—or many thousands of measurements every second.
You may have formal contracts with your site’s users that dictate how much of the time your site will be working and how quickly it will handle certain requests. Even if you don’t have a formal SLA in place, you still have an implied one. Your visitors have expectations. They’ll get frustrated if your site is much slower than that of your competitors, or if your performance is inconsistent and varies wildly. On the other hand, they’ll be more tolerant of delay if they’re confident that you’ll give them the information they’re after or if you’ve been recommended by others.
Failing to meet those expectations hurts your business:
A site that’s unresponsive or plagued by incidents and unpredictable availability has lower conversion rates.
Sites that deliver a consistently poor end user experience are less likely to attract a loyal following. Poor site performance may also affect perception of your company’s brand or reputation.
You may be liable for damages if you can’t handle transactions promptly, particularly if you’re in a heavily regulated industry such as finance or healthcare.
Poor performance may cost you money. If you have a formal contract with users, you may be liable for refunds or service credits. Slow or unavailable sites also encourage customers to find other channels, such as phone support or retail outlets, that cost your organization far more than handling requests via the Web. Once visitors try those channels, they may stick with them, costing you even more money.
There are six fundamental reasons companies measure the performance of their sites:
To establish baselines
To detect and repair errors
To measure the effectiveness of a change
To determine the impact of an outage
To resolve disputes with users
To estimate how much capacity will be needed in the future
You need to determine what “normal” performance and uptime are, partly so others can tell whether you’re doing your job and partly so you can set thresholds to warn you when something is wrong.
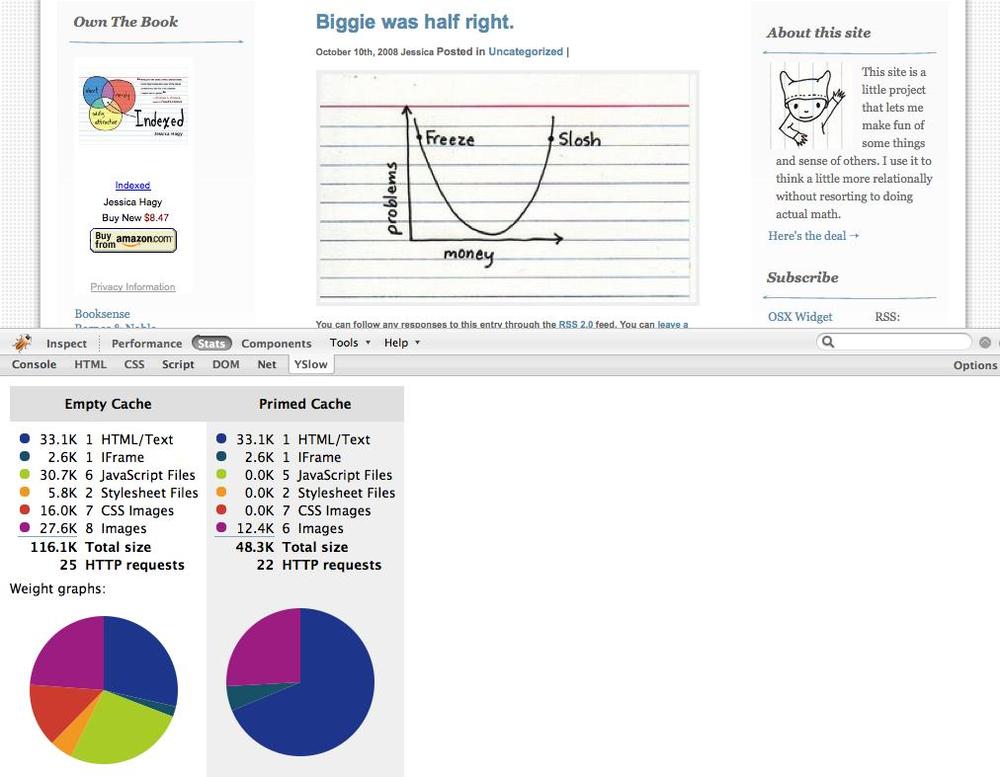
The developer who built your website had an idea of what performance should be like. She was using an idealized environment—her desktop—connecting to a server that was otherwise idle. To understand the composition and efficiency of a web page’s design, developers rely on tools like Firebug and YSlow (Figure 8-2).
Once launched, websites seldom perform as expected. Changes in traffic, Internet conditions, and visitors’ specific hardware and networks all affect how quickly a page loads. The performance you see during release testing won’t match what users experience on a busy day, and to understand the impact of load you need to monitor the application at all times of the day, every day of the week. You also need to consider a variety of user environments. Knowing that your site is slow today is interesting, but knowing that it’s slow every week at 3:00 A.M. is something you can act on.
Your analytics data can show you when peak traffic occurs, and can even identify times when particularly large or processor-intensive pages are being requested. Some sites, like online flower stores, university enrollment platforms, and tax filing portals see a hundredfold increase in traffic on just a few days of the year, and are comparatively idle the remainder of the year.
If you don’t know what those expectations should be, a great place to start is to try your competitors’ sites to see what performance they offer. Without agreement on what’s “fast enough” and when maintenance is allowed, you’re aiming at a target that the rest of the company can move whenever it wants to.
The most obvious day-to-day use of website monitoring technologies is to detect problems with the site before you hear about them from users. This improves total uptime and reduces user frustration.
Many companies that deploy monitoring tools are shocked by what they first see. They discover that users have been working around problems and suffering through slow-downs the site’s operators knew nothing about. Because many of the commercial EUEM applications and services help you to visualize performance and availability, it’s easy to communicate these problems with other departments and get the support and capital to fix them.
Web applications are always changing (or at least, they should be if you’re heeding our advice on web analytics and experimentation). Often, companies will find a version of a site that tests well with visitors but has an adverse long-term impact on EUEM or capacity. There’s a trade-off to make, which is one of the reasons that user experience is now a concern for marketers as well as technologists.
Even if you’re not altering content and software yourself, your server and hardware vendors may be sending you upgrades, or your service provider may be changing routing. Like it or not, you’ll be overseeing hundreds of changes. Without monitoring performance before and after the changes, you’ll have no idea whether things got better or worse.
EUEM tools answer a crucial question behind any change to content, code, equipment, or service providers: did the change make performance better? “Better” may mean faster, or less costly, or more reliable. Ultimately, however, you need to tie the change back to business outcomes like conversion, stickiness, and adoption. Dynamic web content updates need to be a part of your organization’s change, configuration, and release management processes.
No matter how well you’re doing your job, something will break. In the early days of web operations, sites went completely off the air. Today, we’ve developed technologies like load balancing and redundancy for websites to prevent most site-wide errors. Instead, errors are transient, affecting some users but not others.
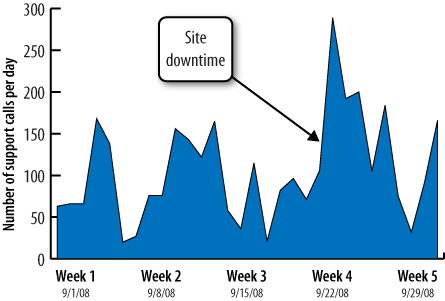
When things break, you need to know the impact of the outage. How many users were affected? When the site returned, was there a flood of returning traffic that slowed things down? You need to track health so you can tie outages to changes in user behavior, such as a spike in phone banking when the web portal gets too slow (Figure 8-3).
In the IT world, the concept of Business Service Management (BSM) encourages us to treat every IT system as a business service. Hardware and network metrics need to be tied to business terms such as lost sales, abandoned shopping carts, and reduced contributions.
There’s no substitute for the truth. By monitoring your site through tests or user monitoring, you’ll know what actually transpired. In disputes with customers, you’re able to replace anecdotes with accountability.
If you have contractual obligations with your subscribers, you can prove something wasn’t your fault and avoid having to issue a refund. If you’re a SaaS provider, you have to deliver uptime and performance that’s acceptable or your customers will cancel their contracts and you’ll see increased churn, which will reduce revenues and mean you have to spend more money on sales.
Dispute resolution can go even further. By capturing a transcript of what happened, you have a record that may hold up in court. Some heavily regulated industries rely on these records. Consider, for example, an insurance portal. If a buyer purchases fire insurance, then suffers flooding damages and claims, “I actually bought flood insurance but the server got it wrong,” having a copy of the user’s session is extremely handy.
So you’re monitoring the site, validating changes smoothly, optimizing campaigns, fixing problems as they occur, and resolving arguments with newfound finesse and aplomb. Great—your business is probably growing. And that means it’s time to add more capacity.
How do you know when you’ll need more servers? Because performance and availability can be related to traffic loads, as was the case for Twitter’s Fail Whale (Figure 8-4), you can use performance data and web analytics to understand how soon you’ll need new physical or virtual machines. EUEM tools let you profile your application to understand where bottlenecks occur and to see which tiers of your infrastructure need additional capacity.
These days, there are so many moving parts in a web application that analyzing end user experience can be tough. Despite all the mashups, plug-ins, mobile browsers, and rich content, however, if you understand the fundamental things that make up a web transaction, you’re well on your way to measuring the experience of your website’s end users.
At its core, EUEM can be broken down into two components: availability and performance.
As visitors interact with your site, some of them will have problems. These fall into two categories: hard errors and soft errors. Hard errors are the obvious ones—the application has broken, and the visitor sees a message to that effect. This includes the ubiquitous 404 message, errors saying that the database isn’t working, an abruptly terminated connection, or a sudden period of network congestion. They’re easy to find if you know what you’re looking for because there’s a clear record of the error happening.
Soft errors are those in which the application doesn’t do what you intended, for example, a site that forces users to log in twice, a navigational path that’s broken, a form that won’t let users submit the right data, or a page whose buttons don’t work. Soft errors are more difficult to detect and more costly to diagnose because they confuse users without making it clear that the application is to blame.
In the end, errors can happen with the application, the network, or the infrastructure. With the many technical disciplines involved, resolving an outage can often mean getting everyone on a conference call to argue about why their part of the site isn’t to blame. Better monitoring avoids these calls, or at least ends them quickly. This is why organizations need to start thinking of their websites as end-to-end systems, focusing on end user experience, and making web operations an integral part of a BSM strategy.
Your visitors will experience widely varying levels of performance. There are dozens of factors that affect the latency of a website:
Something specific to the user, such as a slow connection or an old computer. This is a client-side issue best handled by customer service, site requirements, and user expectations.
Slowdowns on the Internet, such as periods of congestion or connections from far away. This is a service management issue that can be addressed by choosing the right service providers, using content delivery networks (CDNs), and having a good geographic distribution strategy across your data centers.
Server software that’s inherently slow because it’s doing something time-consuming, such as generating a report. This is a performance tuning issue that can be addressed with software engineering.
Infrastructure that’s insufficient to handle the current traffic load because many users are competing for resources. This is a capacity issue that can be addressed with additional servers or equipment.
Application issues that are inherent to the kind of website you’re running, the application server you’re using, or the dependencies your application has on other systems.
The ultimate measurement of performance is how long it takes for the user to interact with the application. Slow performance isn’t the only problem, however. Inconsistent performance can be particularly bad, because users learn to expect fast performance and assume your site is broken when delays occur, which amplifies abandonment.
Now that we know why performance and availability matter, let’s look at how a web session works and where things go wrong. We’re going to give you a working knowledge of web protocols, but we’re going to keep it specific to HTTP and focus on things you need to know. If you’re interested in learning more about networking, we strongly recommend Richard Stevens’ book TCP Illustrated (Addison-Wesley Professional). For a better understanding of HTTP, check out HTTP: The Definitive Guide by David Gourley et al. (O’Reilly).