
Setting up synthetic testing is relatively easy, provided that you have a working knowledge of your web application. To test dynamic features, you’ll also need a “dummy” user account that can place orders, leave messages, and log in and out without having an impact on the real world.
Also consider how you name your test accounts and your test scripts. The name “testscript5” will be much less meaningful than “westcoast-retail-orderpage” when you’re configuring alerts or trying to tie an outage to a business impact.
Testing services generally bill per test. Four main factors affect how much your bill will be at the end of the month:
- Test count
The number of tests you want to run
- Test interval
How often you want to run them
- Client variety
The number of different clients you want to mimic in terms of browser type, network connection, desktop operating system, and so on
- Geographic distributon
The number of locations you want to test from, both in terms of geography and in terms of the Internet backbones and data centers
You’ll also pay more for some of the advanced features outlined earlier, such as browser puppetry, multipage transactions, error capture, and object drill-down.
You should test every revenue-generating or outcome-producing component of your site, and perform comparative tests of a static page, a dynamic page, and a database-access page. If you rely on third-party components, you may want to test them, too.
That sounds like a lot of tests, which is bad news. Adding tests doesn’t just cost more money, it also places additional load on your infrastructure that may impact real users. So you need to be judicious about your monitoring strategy. Here’s how.
It’s not necessary to run every test from every location. If you already know your site’s performance and availability from 20 locations, there’s no incremental value to testing the database from each of those 20 locations unless the database somehow varies by region. The trick is to identify which tests can check functionality from just one location and which have to be run from many sources to give you good coverage.
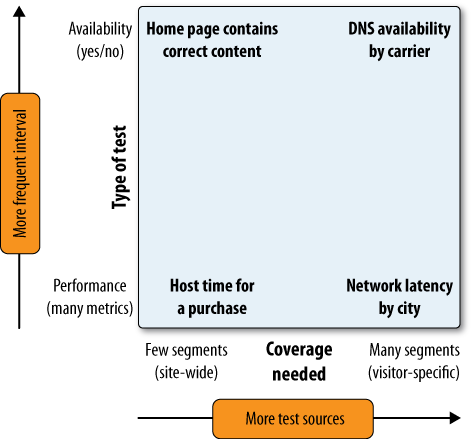
Functional tests examine a key process, such as posting a comment on a blog. They only need to be run from a few locations. You will have many functional tests—sometimes one test for every page on your site—verified from few locations. They’re the things that don’t vary by visitor.
Coverage tests examine aspects of your website that vary by visitor segment, such as web performance or a functioning DNS within a particular ISP. You will have few coverage tests—sometimes just a single page such as the landing page—verified from many networks and carriers.
Resist the temptation to run a wide range of functional tests from many locations. You’ll make your site slower and your monitoring bill bigger without improving detection or adding to diagnostic information.
Now that you’ve separated your functional tests from your coverage tests, you need to decide how often to run them.
Availability testing checks to see whether something is working, while performance testing collects measurements for use in trending and capacity planning. Because of this, availability testing needs to run often—every five minutes or less—while baselining tests can run less often.
Operational data is tactical, intended for use by your networking and system administration teams to detect and repair problems, and by your marketing and development teams to verify whether a recent change works as soon as it’s released. In the former case, it will be tied to alerting, and in the latter, it will be tied to a particular change, such as a software release or a marketing campaign.
The goal of availability testing is to identify issues and help to localize problems so that you can fix them more quickly. You’re likely to change tests whose primary goal is availability testing more often, according to business decisions and release calendars. As a result, you won’t be doing long-term trending of this data—a test may only exist in the system for a few weeks before it is replaced with a new one.
Performance tests won’t change as frequently. You’ll keep test results as baselines for months or even years, comparing one holiday season to another, for example. Data from performance-focused tests is aggregated and displayed through dashboards to business decision makers. It tends to focus on availability percentages rather than on individual incidents, and on performance against a service target rather than sudden slowdowns.
You may also use baselining data like this for capacity-planning purposes, helping you to see a gradual slowdown in performance that may require additional servers, and for setting thresholds and alerts in more tactical, operational tests.
Some desktops are underpowered, which means they take a long time to load and execute JavaScript. Some browsers use older versions of the HTTP protocol or connect across sluggish dial-up links. In other words, not all clients are equal. If you’re hoping to understand end user experience, you have to make sure your tests mimic the conditions of your target audience so that the data you’re capturing is representative of your end users’ experience.
Fortunately, web analytics provides a rich resource for understanding your visitors’ environments, letting you define tests that mimic their browsing experience as well as possible.
The folks at www.eurotrip.com were kind enough to share their analytics data with us, and we will use it liberally in this chapter. The site’s primary focus is on casual European backpackers, and while it is an ad-driven media site, it has some collaborative elements in which visitors share their travel experiences.
Figure 9-20 shows that over 80 percent of Eurotrip’s visitors are using Internet Explorer and Firefox browsers running on Windows.
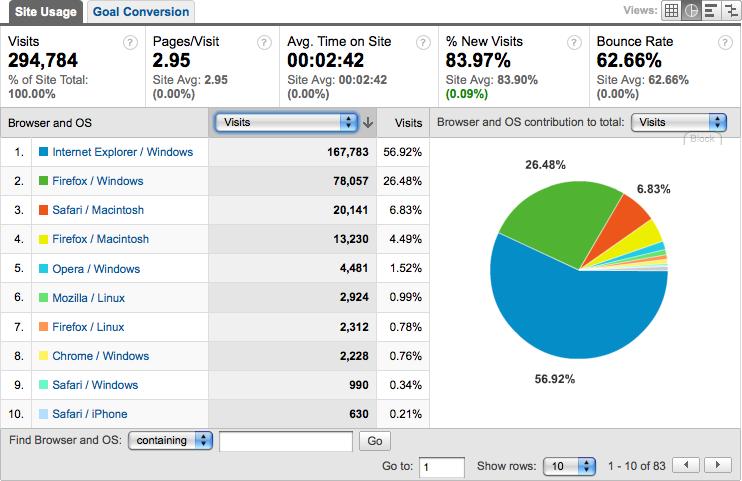
Due to this finding, Eurotrip’s tests should probably simulate a Windows-based desktop. If Eurotrip was willing to pay for additional tests, it might also run tests that represent Internet Explorer and Firefox environments.
Your analytics tools can estimate what kinds of network connectivity your visitors enjoy. This is a rough estimate at best, because the analytics system can’t tell whether delays are related to the core of the network or the edge devices, but it’s a good enough approximation for you to use it to define testing.
Some synthetic services will allow you to simulate dial-up connections. Some even have “panels” of thousands of volunteer computers running small agents that can collect performance data from their home networks, businesses, universities, and Internet cafes, giving you an extremely accurate understanding of your site’s health from domestic dial-up and residential broadband. This last-mile experiential monitoring can be a good way to determine how an application will function in a new market or new geographic region.
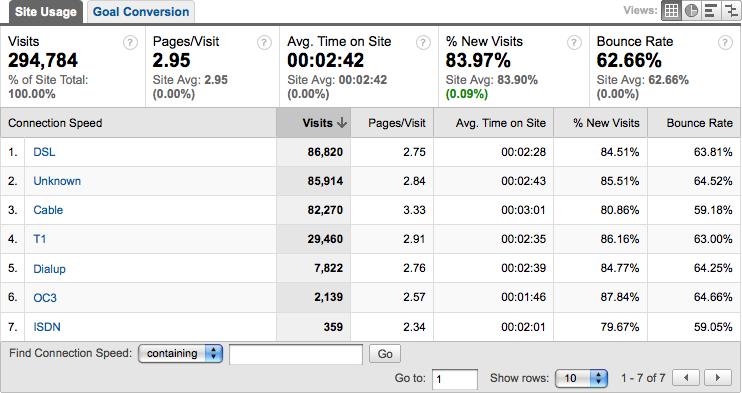
As Figure 9-21 shows, most visitors going to Eurotrip are using DSL or cable modems. With this information, the company can now provision, collocate or request the appropriate carrier types for our synthetic tests.
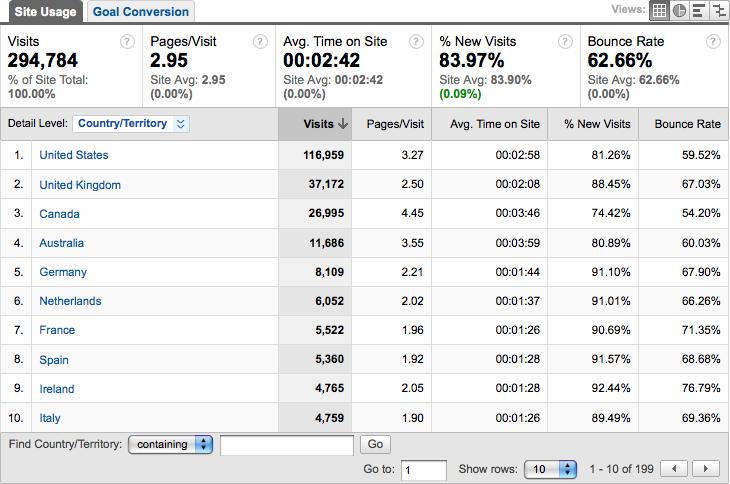
Internet latency is often correlated with geographic distance, and you need to test from the places your visitors are based. Knowing what performance is like for visitors from other countries is essential. For one thing, it will help you figure out when an overzealous shark has chewed up a transatlantic backbone on which your users rely. Measuring remote performance is also useful if you’re trying to decide whether to deploy a CDN to speed up application performance.
Once again, Eurotrip’s web analytics data shows you where its visitors are coming from.
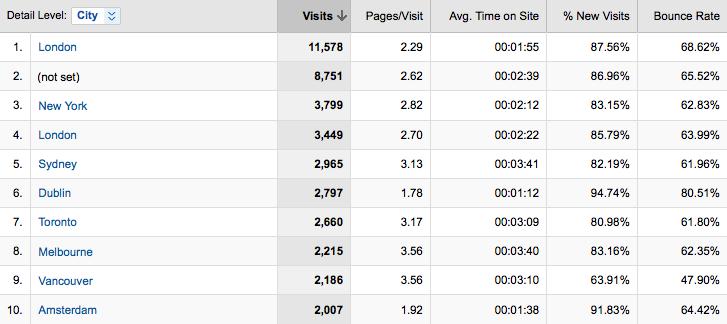
As Figures 9-22 and 9-23 show, most of Eurotrip’s visitors are located in the United States, Europe (UK, Germany, the Netherlands, and France), Australia, and Canada. This is consistent with the business goals of the site. If the site were only targeting customers in a particular region, it could ignore testing from other locations and save some money. For example, a used car dealership in San Jose could safely ignore performance from mainland China.
You can get similar data for visits by network or carrier, which may be important if you have customers on one carrier while you’re collocated on another. For segmenting performance by carrier, you will want to know whether your tests come from dedicated or shared network connections, and whether they’re in a data center or a last-mile location, such as a consumer desktop. You may also need to deploy private testing agents to measure performance from branch offices or important customers if your business needs this data.
Knowing which tests are focused on availability versus performance, and which tests need to be segmented for analysis, you can set your monitoring strategy. Some examples of tests across these two dimensions are shown in Figure 9-24.
Now it’s time to make your test plan using these two dimensions. For coverage tests, identify the segmentation you need: browser types, bandwidth tiers, geographic regions, networks, and so on. Table 9-1 shows an example of this kind of test plan.
Table 9-1. Determining test frequency based on the type of test and the coverage needed
Test type | Segmentation | Frequency |
|---|---|---|
Functional | Low | |
Key pages | Low | |
Tiers (i.e. database) | Low | |
Third-party components | Medium | |
Key transactions | Medium | |
Coverage | ||
Browser types | High | |
Bandwidth tiers | High | |
Geographic areas | High | |
Networks | High |
Your plan will allow you to estimate your monthly service costs, as well as the features you need from a synthetic testing vendor.
It should be clear by now that for sites of any size, test management is a full-time job. Tests are created, modified, and retired as the website changes. You need to track test versions and manage which reports are sent to whom, and should treat them as part of the software release cycle.
This is particularly important if those tests rely on specific pass/fail text on a page that may change across releases, or use “dummy accounts” that require maintenance. Tests grow stale quickly, and you’ll need to maintain thresholds and alerts as the site’s designers change functionality and content.
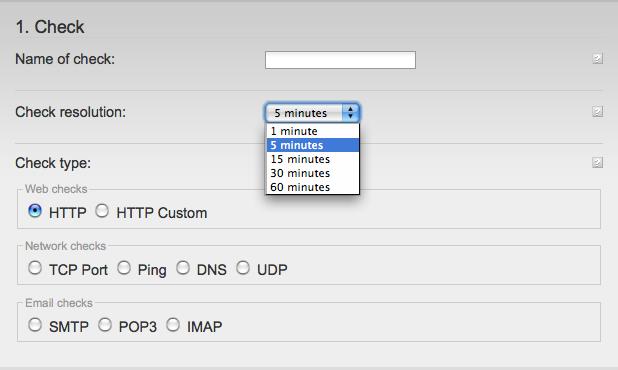
Now that you’ve decided what, where, and how often to test, you need to configure testing. Single-page testing is relatively simple: you provide the URL, the type of test (network, TCP, DNS, and so on), interval, geographic distribution, and any other information that helps the tests to mimic your visitors, as shown in Figure 9-25.
Transactional testing is more complex to configure, and there are many more chances to get things wrong. Fortunately, monitoring service companies often include test recording tools that remove much of the guesswork from setting up tests. Figure 9-26 shows an example of this—you navigate within the target site in a frame, and the recording tool records the steps you take as part of the test.
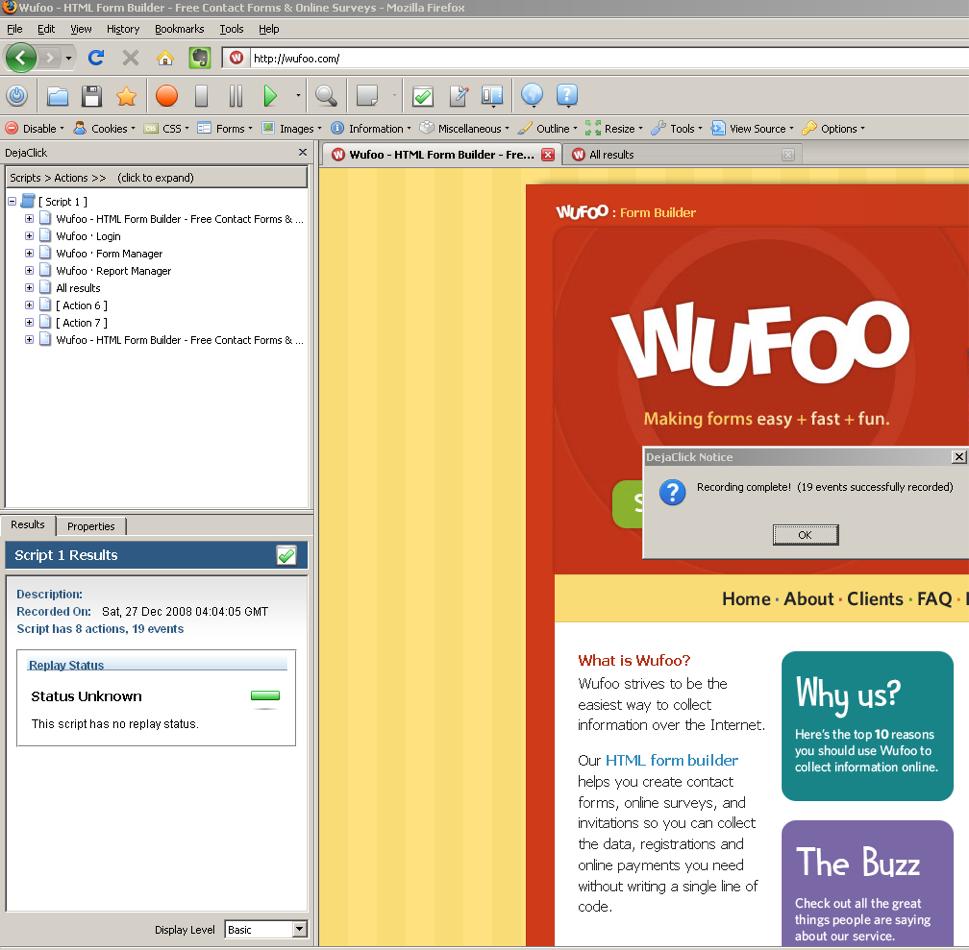
Figure 9-26. Recording a transactional test with Alertsite’s test recorder “DejaClick” on the Wufoo.com website
Once recorded, you can edit the scripts to correct errors made during recording, modify timings, and define what should be used to verify that a page was loaded properly.
When one of your availability tests fails, it will alert you via email, SMS, or voicemail. Alerts can also be directed to software in the network operations center for escalation and correlation with device metrics. Some synthetic monitoring vendors also send SNMP traps to enterprise management software tools.
Alerts fall into one of two main categories. Hard errors occur when a test encounters a problem, for example, a 404 Not Found message when retrieving a page. By contrast, threshold violations occur when a metric, such as host latency, exceeds some threshold for a period of time.
Figure 9-27 shows an alarm configuration screen that defines both hard (availability) and threshold (performance) violations. Setting up a threshold violation alarm requires several details.
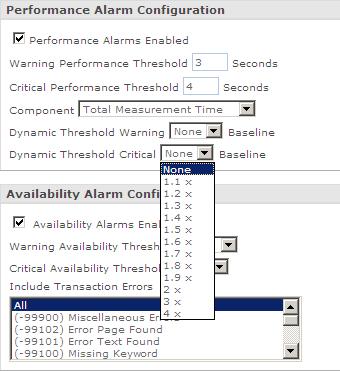
The performance threshold. In this example, there are two thresholds, one for “warning” and one for “critical.”
Which metric to look at (in this case, it’s the total time to load a page).
A dynamic threshold violation (this alerts you if the page performance exceeds the baseline for “normal” performance at this time).
For hard error alerts, you simply need to define which kinds of availability problems to notify about. When defining any kind of alert, you may also have to configure rules about suppression (so that the service only tells you when it’s broken and when it’s recovered, rather than flooding you with error notifications) and verification (so that the service checks several times to be sure the error is real before telling you about it).
A good alerting system lets you sleep at night knowing that if there’s an issue with your website (availability or performance), you’ll be alerted. That system loses its effectiveness if there are too many false positives, but tuning an alerting system can take time. For example, most sites will exhibit different response times from different geographic locations, even within the same country. Setting a single response time alert threshold across all the geographies from which you’re testing from will either cause you to miss critical alerts (if set too high) or get too many false positives (if set too low).
Some services have far more complex alerting systems, including escalation, problem severity options, time zones, maintenance windows during which to ignore downtime, and so on.
Whichever option you choose, your alerts should contain as much business information as possible, such as how many users were affected, the change in website conversions during the outage, or whether the incident happened during a planned adjustment to the site. The perfect alert contains all of the information you need to localize, diagnose, and repair the problem, and to assess its impact on your business.