
When you’re running a VOC study, you will be interested in three things:
- The response rate
How many visitors receive an invitation (either recruited by email or intercepted by pop up) and accept it, arriving at the survey.
- The start rate
How many visitors, once presented with the survey, start it. Some visitors will forget they agreed to participate in the survey and close it, while others may change their minds upon learning more about it.
- The completion rate
How many visitors who, having started the survey, finish it.
Your goal, of course, is to maximize all three of these.
One of the biggest challenges in web surveys is soliciting participation from the right respondents. To begin with, invitations to participate in a web survey get fewer responses than other forms of survey. In 2007, Lozar Manfreda et al. conducted a metastudy that looked across 45 separate studies. Their paper, titled “Web Surveys versus Other Survey Modes – A Meta-Analysis Comparing Response Rates” (International Journal of Market Research 50, no. 1; 79–104), showed that, on average, web-based surveys got an 11 percent lower response rate than other survey modes such as phone or email.
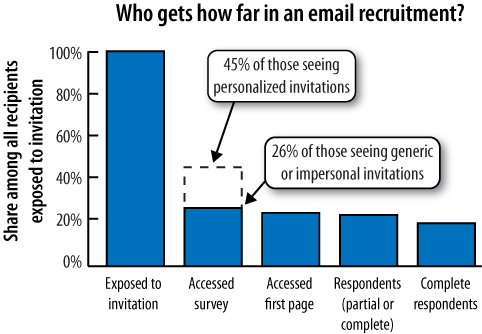
A higher response rate means that your survey results are more representative of your visitors in general. It also means fewer interrupted visitors (since you don’t have to ask as many in order to get the number of responses you want). So, you should strive for the best possible response rate. Unfortunately, that’s not always possible. An earlier study by the same group indicated that 74 percent of people exposed to general invitations and 55 percent of people who received individual invitations never accessed the survey.
Once visitors responded to the invitation, however, 83 percent started to answer the survey and 80 percent completed it, as shown in Figure 7-32 (http://www.icis.dk/ICIS_papers/C2_4_3.pdf). Our discussions with several VOC tool providers confirmed that most studies see similar response rates.
If you’re inviting visitors to participate, you need to make the invitation appealing and give them a reason to devote some time to the effort. Simply being polite works wonders. Smart VOC surveyors also personalize their email messages, state the purpose of the survey up front, send reminder email messages, and ensure that formats and design are simple.
A lightbox approach that overlays the offer on the web page, like the one shown in Figure 7-33, can be particularly good at focusing the visitor’s attention. It’s also an opportunity to give a brief, clear message about your organization that may help reinforce your brand.
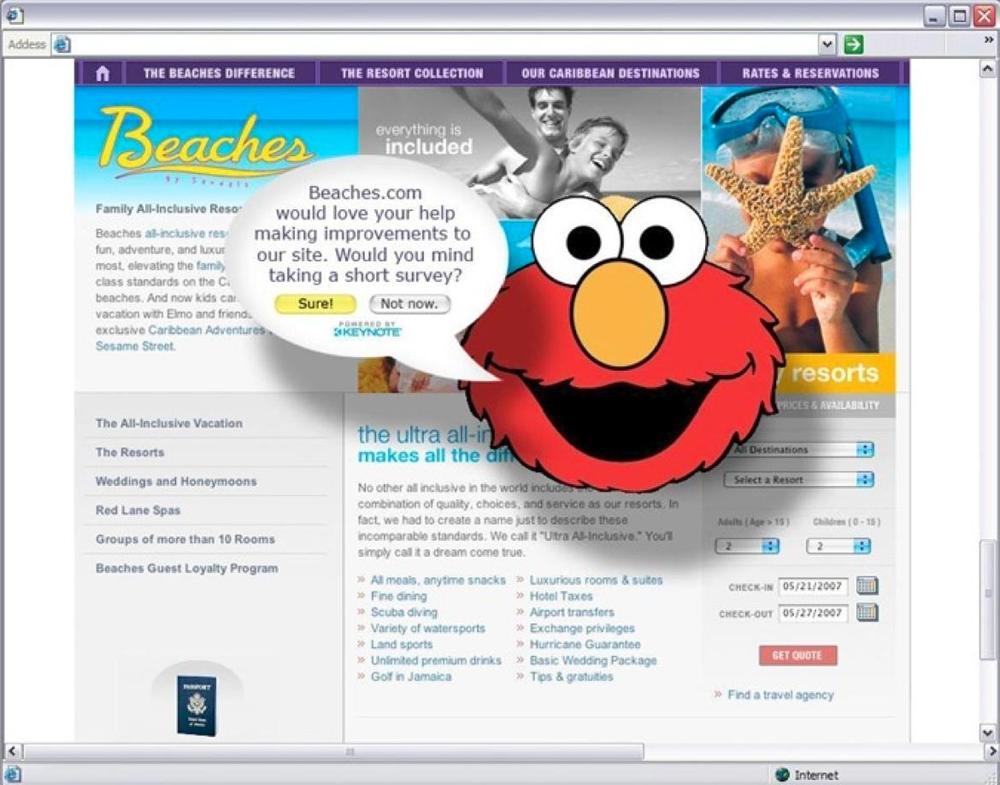
Depending on your target audience, a more impactful and eye-catching approach, such as the one shown in Figure 7-34, may work better. It is your responsibility to test and see which method works best for your audience.
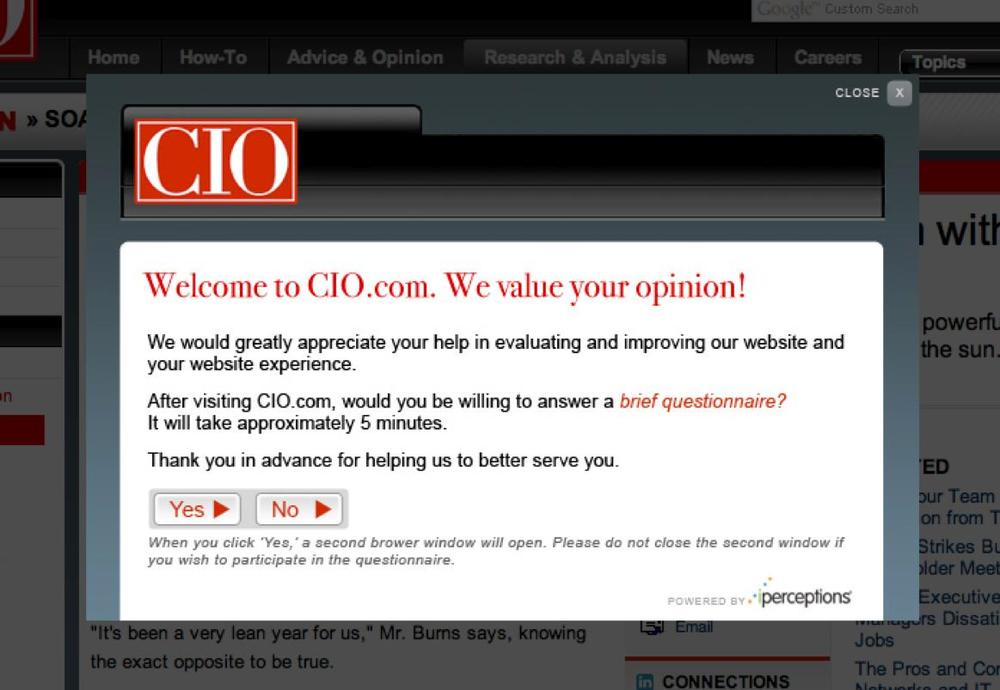
Figure 7-33. A lightbox approach is noticeable and forces visitors to respond, rather than simply letting them close a pop up or new window
As Figure 7-35 shows, another advantage of overlaid invitations is that visitors can see some of the site behind the invitation at the same time, so they associate the survey in front with the brand and content behind it.
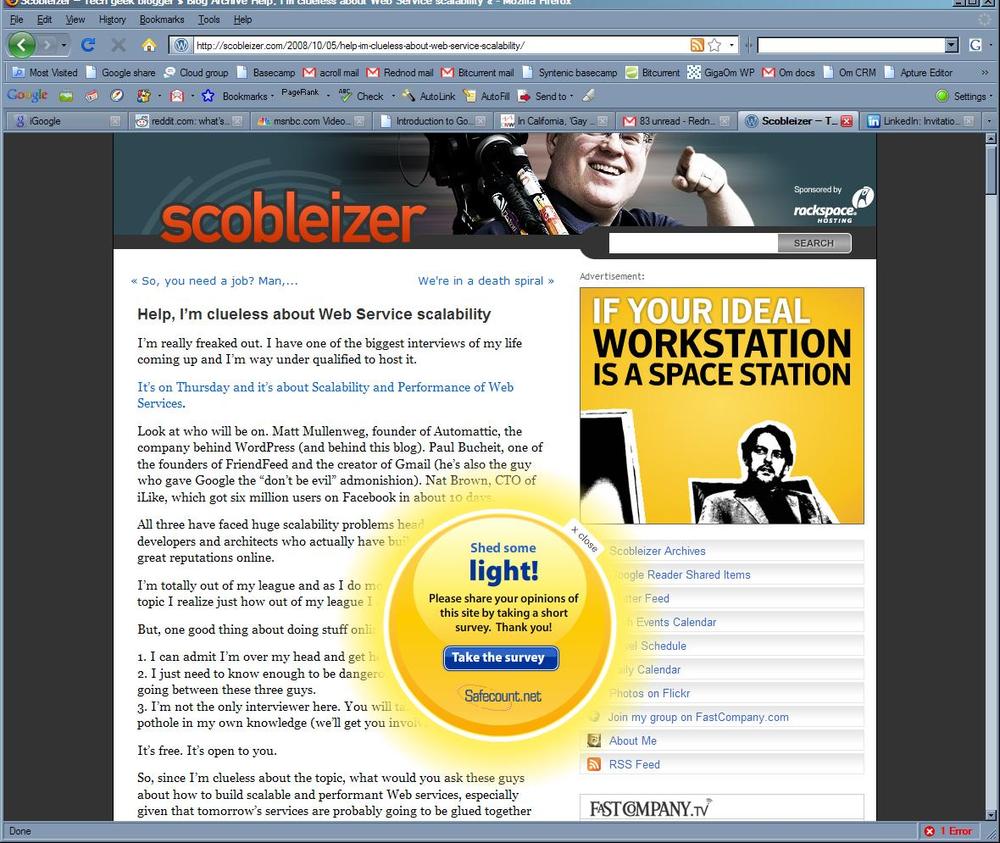
Figure 7-35. The use of an overlay is an elegant method to encourage users to begin surveys, as it still allows users to read a portion of the site
Should you reward respondents for participation? The web operators we’ve spoken with suggest that rewards can increase response rates by 15 to 20 percent, particularly for consumer surveys.
In business-to-business surveys, rewards that are perceived as bribes may have a negative effect. One popular way to avoid this perception is to offer to share the survey’s results with respondents, who may have an interest in some of the outcomes.
Rewards may increase the total number of respondents, but may also reduce the number of responses that fall within your desired respondent demographic. So, if you’re going to reward participation, be sure you ask control questions that disqualify responses from respondents who aren’t part of your target audience and are just on your site to win a prize.
The type of reward you offer may vary depending on survey length, too. A 2004 study on response rate and response quality found that “vouchers seem to be the most effective incentive in long questionnaires, while lotteries are more efficient in short surveys. A follow-up study revealed that lotteries with small prizes but a higher chance of winning, are most effective in increasing the response rate.[1]
If you’re going to offer rewards, it’s important to state the rules and regulations as part of the survey conclusion, as shown in Figure 7-36.
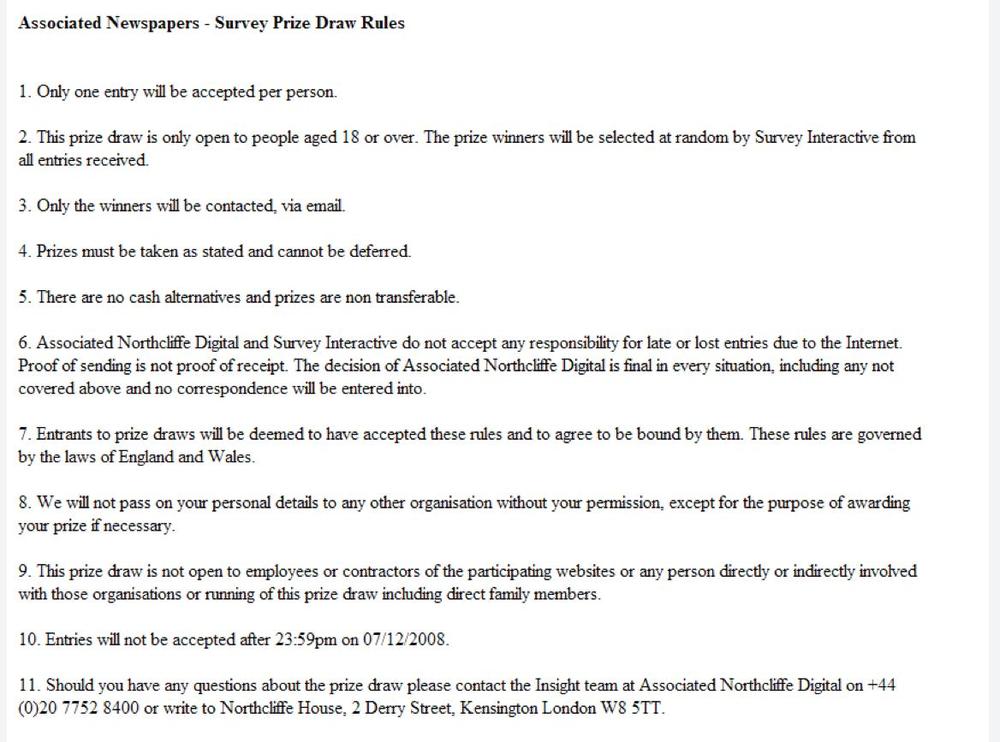
In particular, you may have to comply with state regulations on prizes and contests, and should tell respondents that you will only contact them in the event that they win.
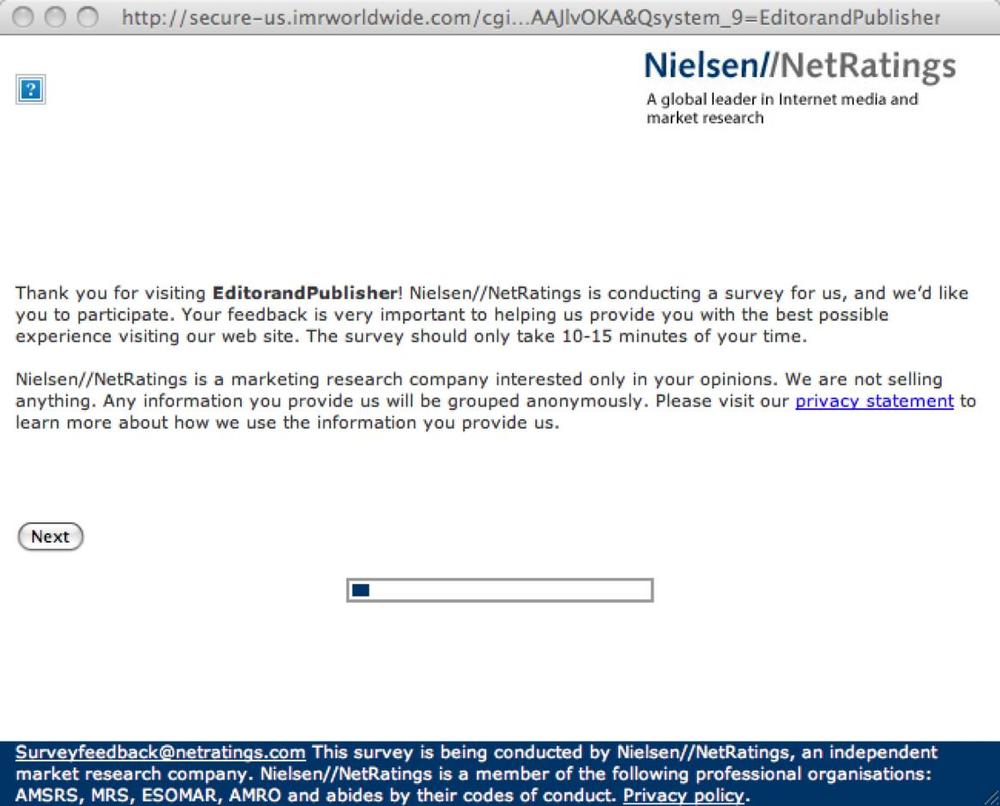
It’s vital that you tell respondents what to expect early in the process. This includes the purpose of the survey, the way in which data will be used or shared, and what steps you’re taking to protect respondents’ privacy. It should also include the estimated time to complete the survey and clear details on how to contact the operators of the survey, as shown in Figure 7-37. VOC vendor iPerceptions noted that when it first added a progress bar to surveys, there was a significant increase in completion rate.
You should always ask whether you can follow up with a respondent, using a question like the one in Figure 7-38, either because you may need further clarification on responses or because you may want to include the respondent in subsequent surveys that rank improvement on the site.
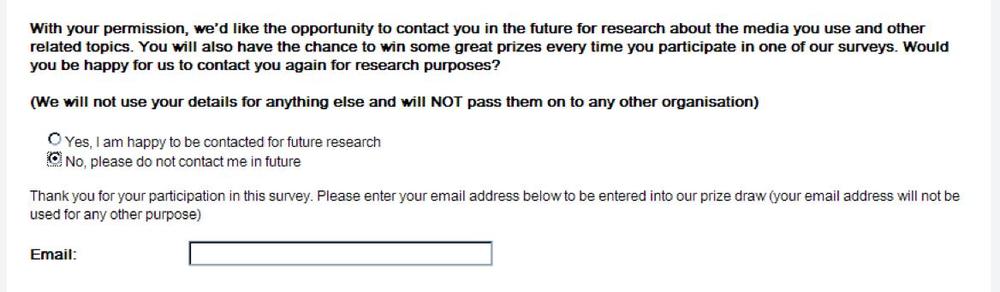
A secondary KPI for your site might be the percentage of VOC respondents who agree to a follow-up and become part of your recruited panel.
If you aren’t getting the results you want from your VOC research, you need to tune your approach. Doing so requires many of the techniques we discussed when looking at web analytics. In many ways, the VOC conversion funnel should be treated as a transaction like any other on your site, and you should monitor and optimize it to ensure you get good information. Here are some problems you may encounter, and suggestions for addressing them.
If your email invitations to respondents are bouncing, you need to make sure your messages don’t look like spam. Using plain-text email messages (instead of image-heavy, multiple-object messages) works well. Similarly, make sure the message is very simple and short, with only a single URL. Try to make the title of the message direct, and address it to the individual, but don’t use words like “survey” or “invitation” in the title—and use them only sparingly in the body of the message.
Invitation recipients are 19 percent more likely to respond to a personal, targeted message aimed at them individually than to a generic one. If you’re targeting your message and still not getting answers, you can consider a reward or try to explain more about why taking the survey will help the recipient somehow. Appeal to recipients’ altruism—making the Web a better place—and explain why they, in particular, have been selected.
You’re asking people to respond when they visit your site, but they’re not taking you up on the offer. You need to optimize your invitation—experiment with several messages and compare the results. Change the point at which the invitation is shown, the segments you target, or the rewards that you’re offering. If all else fails, either recruit respondents or resort to placing questions within the checkout process—just be sure not to hurt conversions.
If people are accepting your offer to participate in the survey, but are not starting the survey, you may want to begin it immediately rather than suggesting that they first finish their visit to the site. You may also be able to use JavaScript to detect when the page is closed and bring the survey window to the front, asking visitors if they wish to close the browser or navigate away from the page without completing the survey.
If users are starting the survey but not finishing it, make it shorter. Long surveys are the main cause of abandonment, and incomplete responses can’t be properly correlated with one another.
Some of the WIA tools we saw in the previous chapter can analyze form completion rates, since they see keystrokes and mouse movements within a page of a form to determine where users are spending the most time, which forms they’re refilling, and which fields they are leaving blank.
This kind of analysis, shown in Figure 7-39, suggests where problems occurred or where the visitor gave up. You’re less likely to be able to integrate WIA monitoring from one vendor with a VOC survey from another, however, so this may only apply to forms you’re operating yourself.
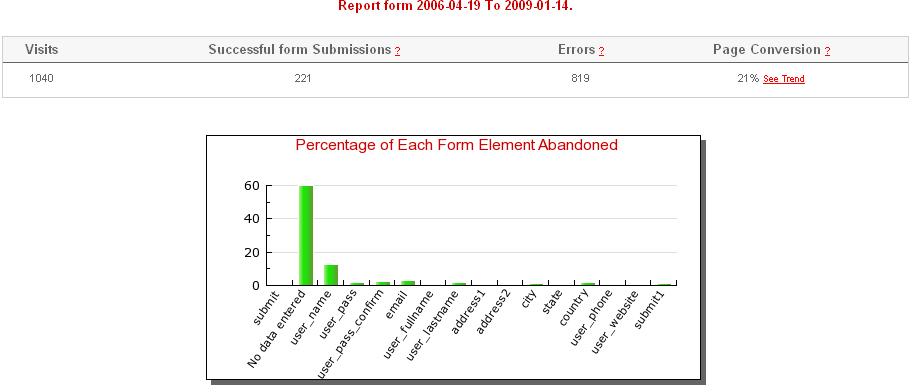
Figure 7-39. Using FormAlive form analysis to identify bottlenecks and troubleshoot survey completion issues
If you’re getting completed surveys, but the results aren’t useful, there may be one of several problems:
- You’re not asking the right people
Demographic data from the survey suggests that you’re hearing from visitors that aren’t your intended audience. Because respondents don’t match the group you’re hoping to analyze, you need to disqualify earlier in the process. If you’re recruiting participants through email, you need to change your mailing list or ask qualifying questions in the email itself. If you’re using a paid panel, you need to urge the vendor to adjust the makeup of its panel. If you’re providing a reward, try removing it and see if this leads to better, albeit fewer, results.
- You’re not asking the right questions
If you’re not getting a picture of what customers are saying, you may be constraining their responses too much. It’s okay to have a hypothesis and test it, but make sure there is room for some open-ended answers (for example, a respondent may write, “Your colors are too bright”). Then analyze the open-ended responses for patterns (“10% of respondents say colors are too bright”), and consider turning them into a more structured question (“Our colors are too bright. Agree/disagree”) in future surveys.
- The users don’t understand the questions
If you’re getting inconsistent responses, some of the respondents may simply not understand what’s being asked of them. See if there’s a pattern of misunderstanding (“More men under 30 answer question five incorrectly”) and retest the questionnaire with that segment to find out where the misunderstanding lies. Often, identifying misunderstandings or confusing terminology can improve your organization’s marketing communications as a whole. If, in the process of optimizing your VOC studies, you identify jargon or words that your market doesn’t understand, be sure to tell the marketing department!
Once you’ve got data you can use, it’s time to analyze it.
Once you’ve collected enough responses, you can start analyzing the data. When respondents can only pick one answer from a selection—usually communicated through a radio button or a drop-down list— you simply count the number of responses. This can be tricky, however, as simple answers can often hide more complicated patterns. In other words, distributions can often be more valuable than aggregations. Thankfully, much of the heavy lifting can be done for you by using the algorithms provided by existing VOC vendors.
It’s critical to consider your results in the context of segments of visitors that responded to your survey. Let’s look at a hypothetical example of how segmentation can show very different results.
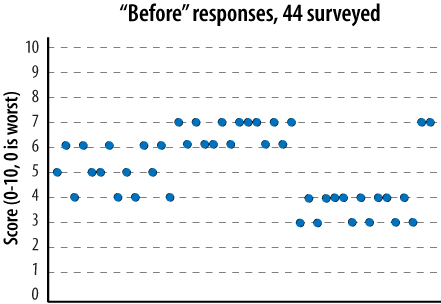
A media site wanted to improve the excitement generated by its visual content. Knowing that results are only useful if compared to something, it first surveyed visitors before making the change to its site. It intercepted 44 respondents, asking them for their impressions of the website on a scale of 1 to 10, where 1 was “bad” and 10 was “good.” The results are shown in Figure 7-40.
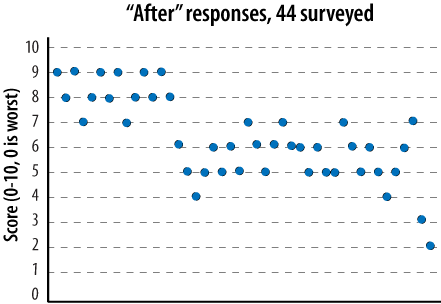
The organization then changed the site, adding glamorous visuals and more movement and multimedia. Again, it collected 44 responses from visitors rating the site. These results are shown in Figure 7-42 (shown later).
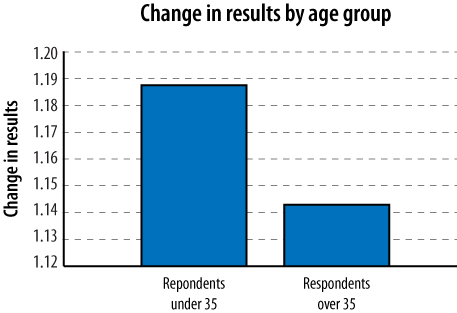
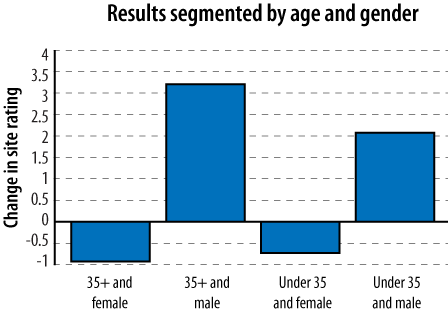
At first glance, the results were encouraging. The rating climbed from an average of 5.15 to an average of 6.31—an 11.6 percent improvement. The web operator had also decided to ask two segmentation questions: respondent age and gender, When segmented along these dimensions, the results were very different.
As Figure 7-41 shows, while the site changes had improved the rating given by younger visitors, it had been less effective for older visitors.
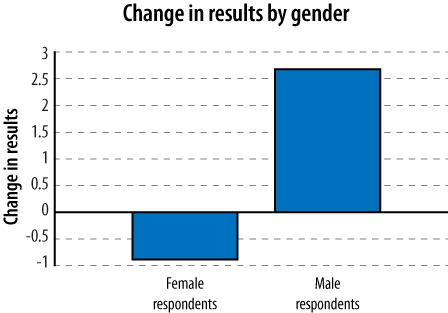
Perhaps most importantly, the results showed that while the changes improved men’s ratings of the site, they had actually lowered ratings from female visitors, as shown in Figure 7-43.
On closer analysis of the data, the company determined that the respondents had not been evenly represented across gender and age. 57 percent of respondents were female and 64 percent were under 35.
This is a fairly straightforward example, but it should show you the importance of data exploration and segmentation. If the site sought the approval of young males, the change might have been a success, but if it was targeting older women, the change was a disaster, as summarized in Figure 7-44.
While a full discussion of statistical analysis is beyond the scope of this book—and most commercial packages offer tools to help with this—here are some things to bear in mind.
The easiest data to analyze is whatever you’ve collected numerically. This may be a value you’ve asked visitors to give you (“How many other social networks do you belong to?”) or rating data (“On a scale of 1 to 5, where 1 is dismal and 5 is awesome, how good is this site?”).
Every time you analyze numbers you need to calculate some basic statistics (Table 7-3).
Table 7-3. Some basic statistical terms
Measurement | What it means | How it’s calculated | Concerns and uses |
|---|---|---|---|
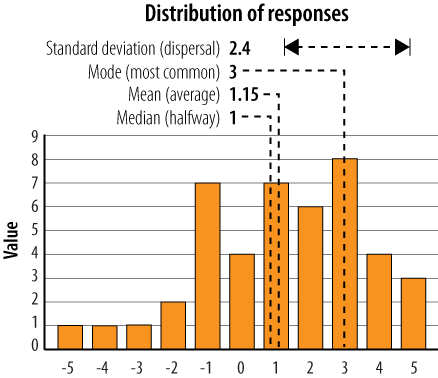
The average of all responses | Add the answers and divide by the responses | Averages can be misleading—a few outliers can strongly influence them, so it’s common to trim off the highest and lowest values to get a better sense of an average | |
The number that “splits” all the responses in half | Sort the responses and find the halfway point | Better for finding middle ground than an average when there are large outliers | |
The response that happens the most | Count how many times each value or category is seen | Helps you understand what’s most common in responses; unlike means and medians, modes apply to categorical data, for example, “the most common name in the survey is Smith” | |
How dispersed the answers are | Add up how far each response is from the mean, square the results, find the mean of that square, and take the root of it | If all respondents provided the same answer, there would be no deviation; if answers varied considerably, standard deviation would be high; standard deviation is a measure of uncertainty |
Wikipedia maintains a comprehensive discussion of statistics and provides more detailed information on some of these terms at http://en.wikipedia.org/wiki/Portal:Statistics. Figure 7-45 shows how the four statistical metrics describe the distribution of the 44 responses we looked at earlier.
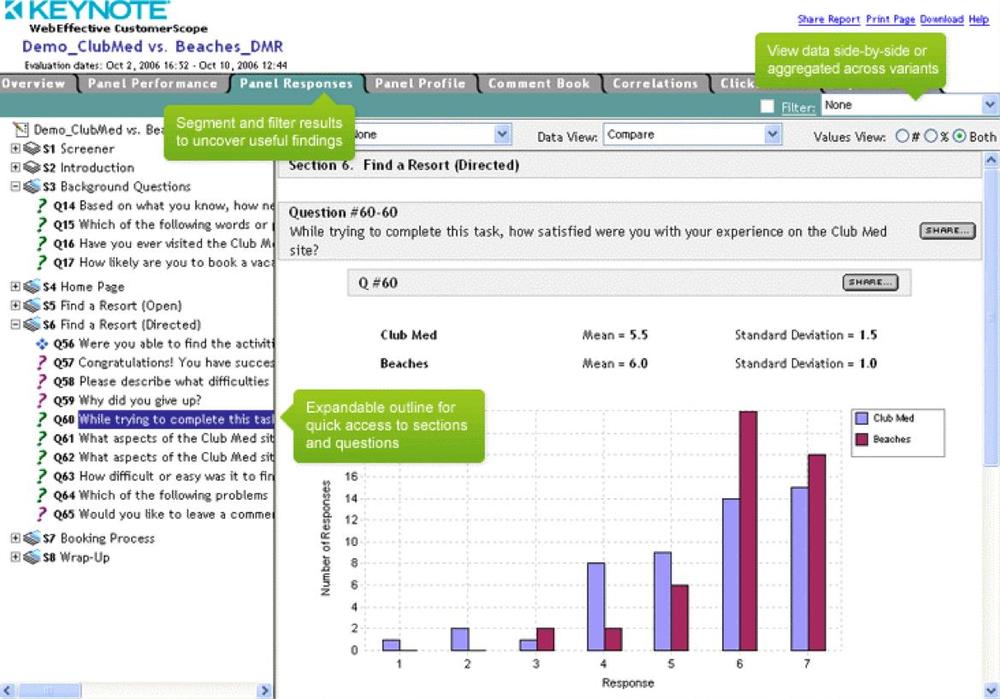
Most commercial software will calculate means and standard deviations, as well as segmenting across various categories of data you’ve collected. Figure 7-46 shows an example of this.
In addition to aggregate analysis of visitors’ responses, most tools will let you view an individual response as well (as shown in Figure 7-47). As we’ve seen, looking at the individual responses and understanding their distribution can be far more revealing than just looking at averages.
It’s important to be able to move from aggregate trends—overall customer satisfaction, main reasons for complaints, top motivations, and so on—to individual responses. This way, you can understand patterns while still gleaning the open-ended insights for which VOC is so important.
To visualize multiple-choice data, you can simply show scores for each answer or a “top five” list. Figure 7-48 shows more complex data—in this case, a comparison of two brands’ rankings along with a statistical description of the results.
If you ask respondents for a list of responses in order, you’re collecting ordinal data. For example, you might say, “List your five favorite ice cream flavors, with the most favorite first.”
While this data is useful, you may want to weight it to ensure the best visualization. You may give a weight of 5 to the first answer, 4 to the second, and so on. The result is a weighted scoring of preference that you can add up across respondents.
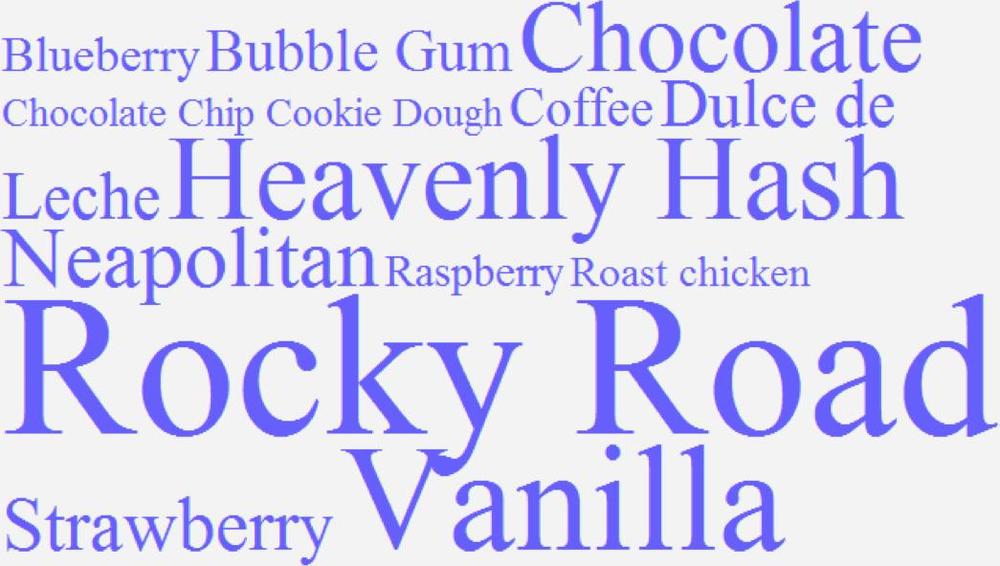
Displaying many possible answers can be challenging. New visualizations such as the tag cloud shown in Figure 7-49 can help you analyze data for patterns and trends that might not be as obvious.
If you’re asking users to submit open-ended data and you have relatively few responses, you owe it to yourself to read them individually. If you have large numbers of open-ended responses, you may want to analyze only those whose quantitative responses are unusual, for example, people who had an extremely unsatisfying experience or those who could not complete a task.
Some VOC services offer parsing tools that will look at important words (nouns and verbs) and analyze them, presenting them as ordinal data based on how often they occur, or in tag clouds. Advances in natural language parsing and semantic interpretation promise to make it even easier to extract sentiment and meaning from a large number of responses.
Once you’ve extracted VOC data, you may want to share it with other data sources. Some web analytics vendors offer data warehouses in which VOC responses and performance metrics can be analyzed alongside analytics.
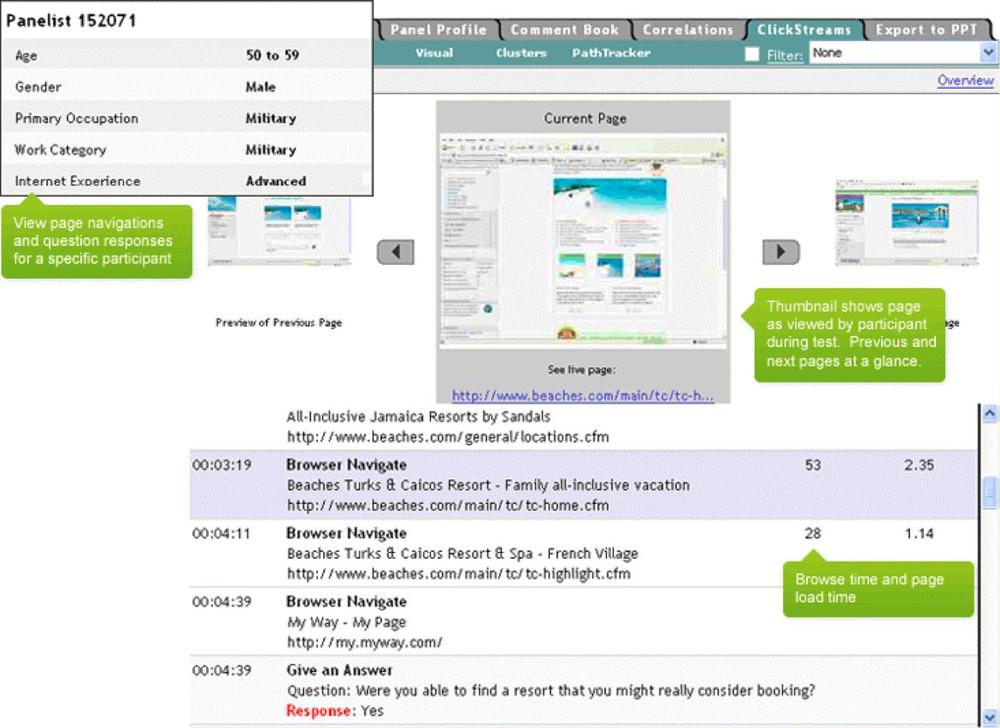
Depending on the service you’re using, user activity may have already been captured along with responses, as shown in Figure 7-50. This is the case for some recruited panels in which respondents install software to track their visits. If you’re using such a service, you can see who a visitor was, what she did, and her responses within the same page.
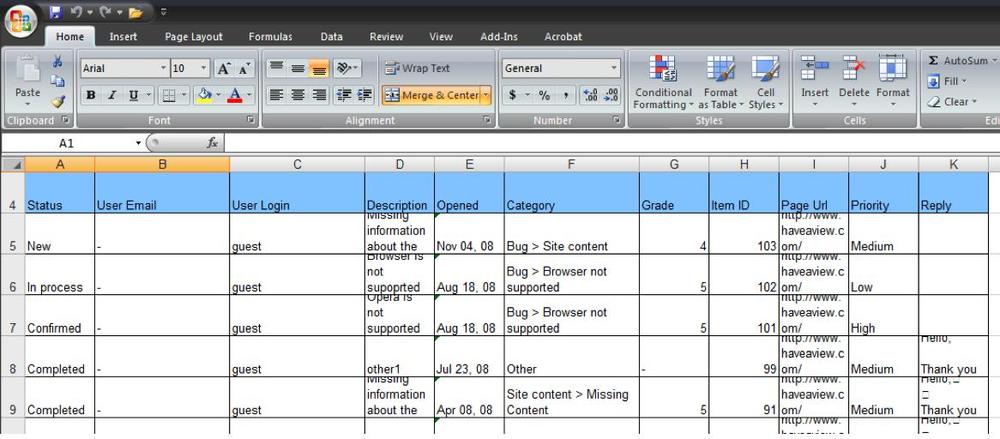
If you’re manipulating large amounts of VOC data, you may want to export it to a spreadsheet or to statistical software, as Figure 7-51 shows. Many tools and survey sites can export data as comma-separated value (CSV) files suitable for importing into such software packages.
If there’s one theme throughout this book, it’s the convergence of web visibility tools. VOC is no exception.
There are examples of VOC companies that integrate with WIA and web analytics platforms, but this is something that we’ll look at in more detail in Chapter 17.
[1] Deutskens, E.; de Ruyter, K.; Wetzels, M.; Oosterveld, P.; “Response Rate and Response Quality of Internet-Based Surveys: An Experimental Study”, Marketing Letters 15, no. 1 (February 2004): 21–36(16).