
We’ve looked at testing various “depths” in the tiers of the web application, from DNS all the way back to the application server and database. Single-object HTTP requests still leave many questions unanswered, though. How long do whole pages take to load? Can users complete multistep transactions? Are page components functioning correctly?
The majority of synthetic tests retrieve a page, then all of its components. A standard web page lists all of the components it contains; the testing system parses this page, then retrieves each component. The number of concurrent connections between the client and the server affects the total time the page takes to load, and the result is a “cascade” of objects that ultimately drive the total page load time, as Figure 9-12 shows.
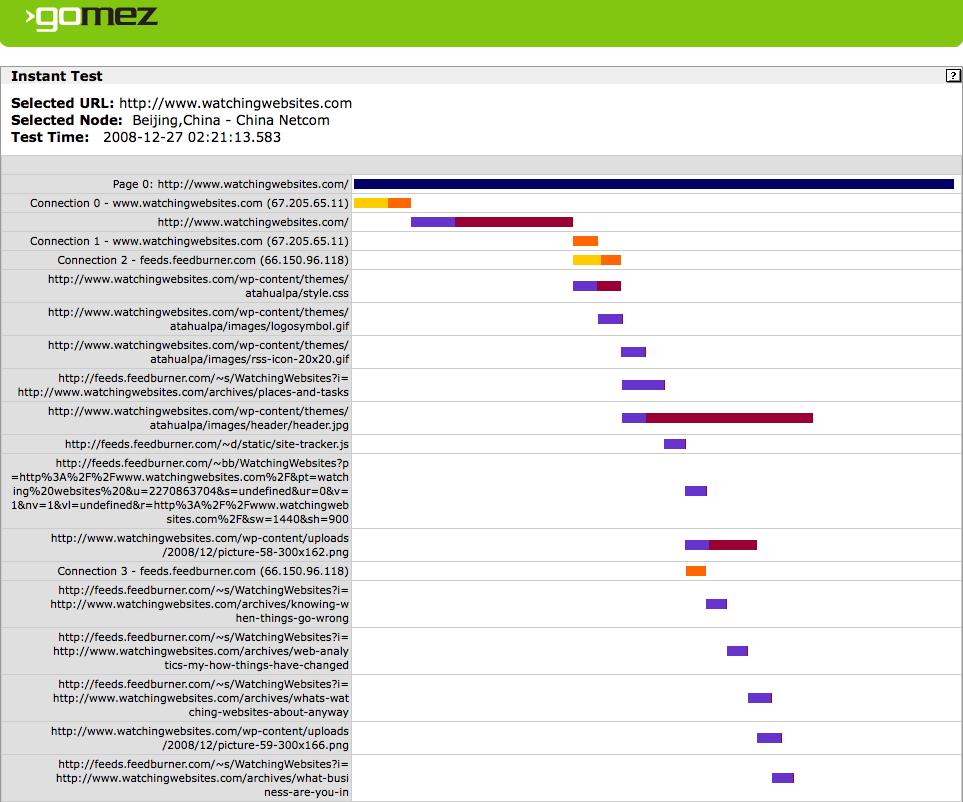
Figure 9-12. A cascade diagram from Gomez showing watchingwebsites.com and all its component objects being loaded from Beijing, China
In the modern Web, a site is only as good as its weakest component. Small components—JavaScript elements, Flash plug-ins, map overlays, analytics, survey scripts, and so on—can limit the speed with which the page loads, or even affect whether it loads at all, as shown in Figure 9-13.
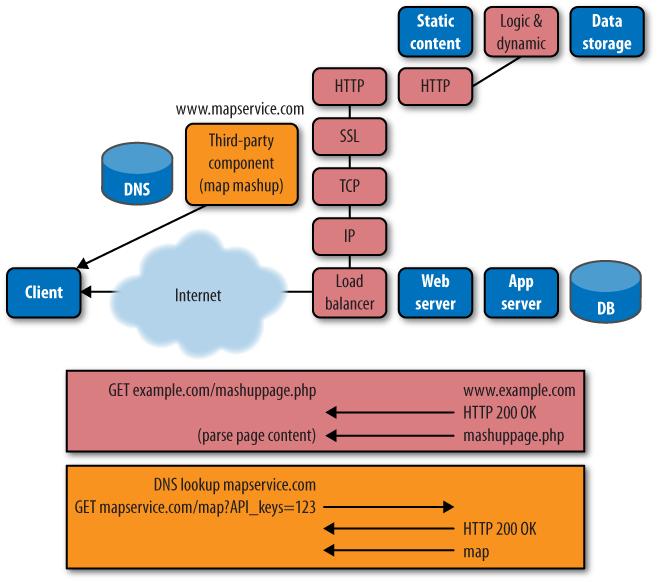
Figure 9-13. A complex page retrieval that includes data from a third-party site such as a mapping service
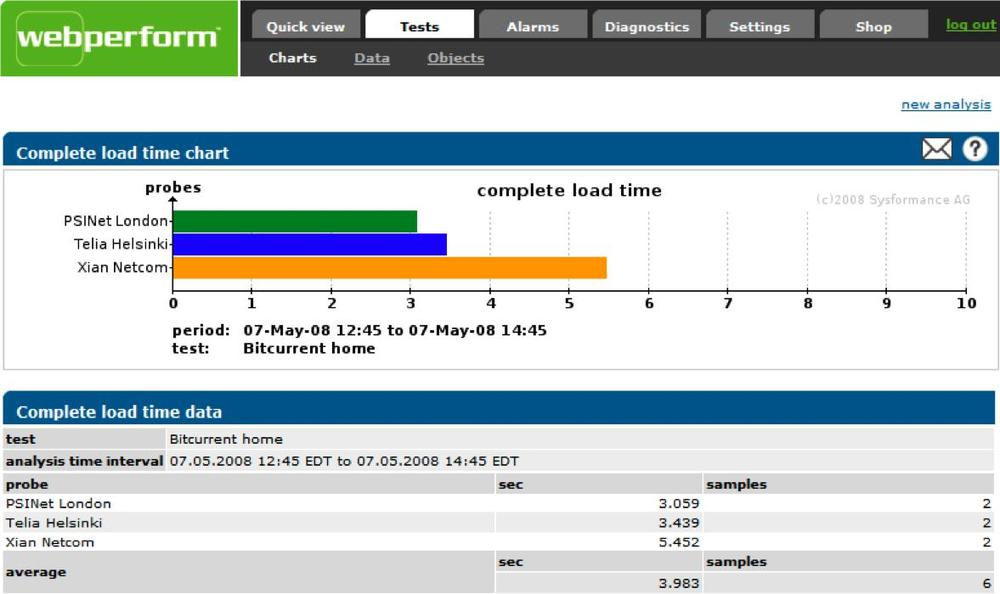
If you’re using a compound monitoring service, you’ll be testing these components each time you check your own site. Synthetic testing services perform the test from several locations and networks using several browser types, at regular intervals, and report the data in aggregate charts like the one in Figure 9-14.
What if you want to measure a multistep process? It’s time to record and replay a transaction.
Many synthetic testing services allow you to record a series of transactions and then repeat the sequence at regular intervals. The result is an aggregation of the total time it takes to complete a transaction. Figure 9-15 shows an example of this kind of data for Salesforce.com.
This is particularly useful if various steps in a user’s experience put load on different systems. Imagine, for example, a purchase on a music site: the visitor searches for a song, posts a review about the band, adds an album to her cart, provides her payment information, and confirms the purchase. By testing a transaction, you see which components are slowest or most error-prone. You can also segment the results to see if certain visitors are having a particularly bad experience, as shown in Figure 9-16.
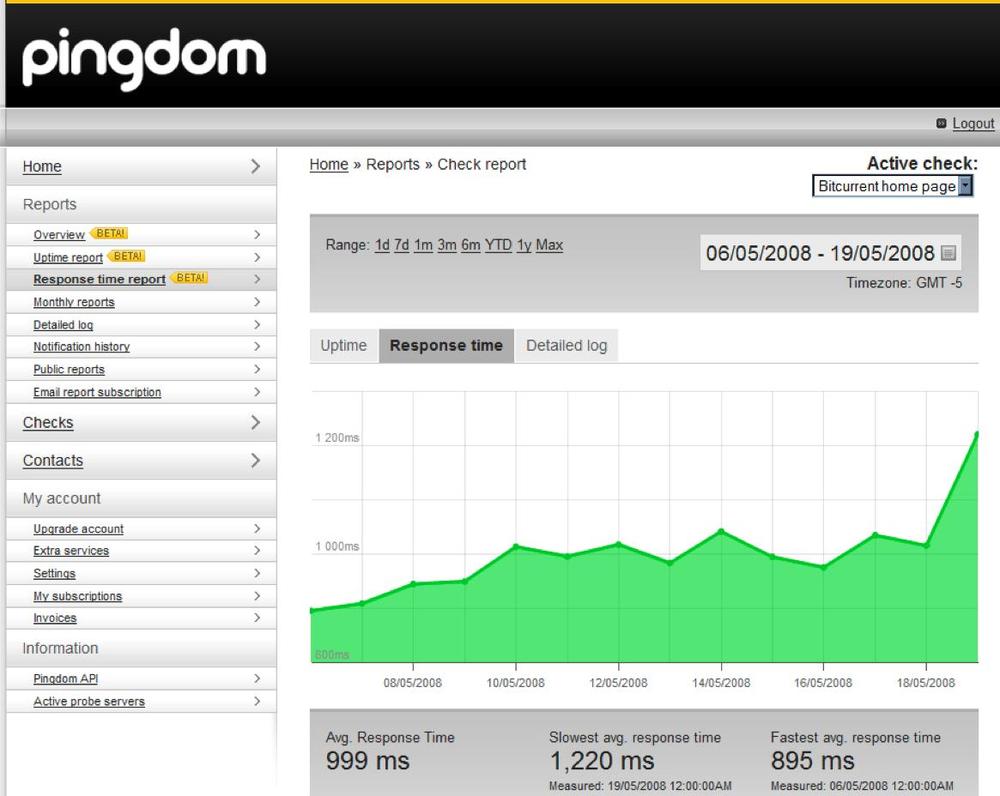
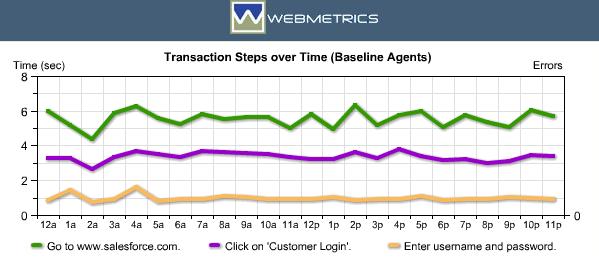
Figure 9-15. A Webmetrics multistep transaction performance report showing the performance of three transaction steps in Salesforce.com
There are some things you can’t monitor with synthetic testing, however. If one step of a process commits to an action, such as charging a credit card for a pair of shoes, the synthetic tests will have all-too-real consequences.
One way around this is to work with developers to set up a “dummy” user account and neuter its ability to execute real transactions. However, the synthetic test can’t actually verify that the real process works, since it’s not using a real credit card. This is one reason it’s essential to have both synthetic testing and RUM as part of your EUEM strategy.
You’ve seen how you can probe deep within a site using synthetic testing, and you are now familiar with the way in which synthetic testing systems aggregate HTTP requests into pages and sessions. Different solutions offer different levels of detail in what they report.
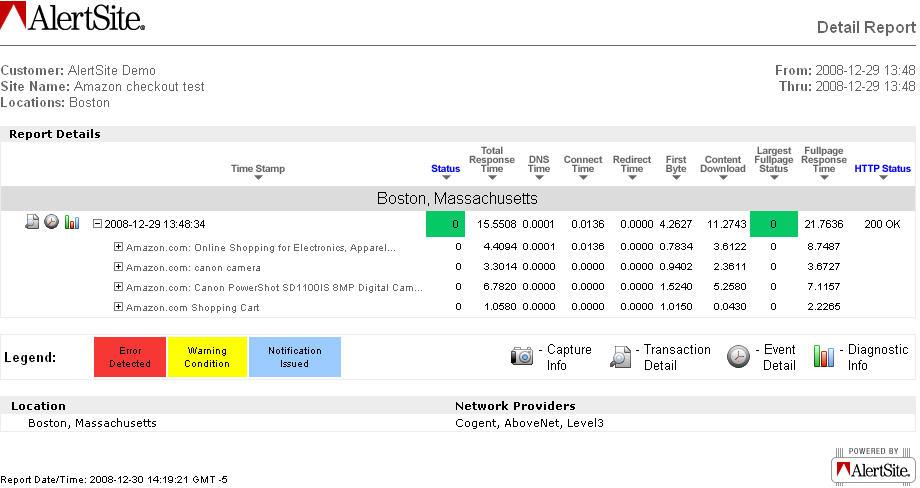
Some services, such as the one shown in Figure 9-17, report performance only at the page level. They may simply report total page load time, or they may break latency up into its component parts, including DNS latency, time to first byte, connection time, content time, and redirect time.
Other services break the page down into its component parts, showing you the latency and problems within the individual pages. This information is more useful to operations and engineering teams, can sometimes lead to quicker answers and resolutions, but also costs more.
Some testing services keep a copy of pages that had problems so you can see the error that actually occurred. In addition to showing you firsthand what the error looked like, error recording makes it easier to troubleshoot your synthetic testing setup and identify problems that are causing false alarms, such as mistyped URLs.
There are significant differences between vendors here, and it’s the basis of much competition in the monitoring industry. Some vendors capture container objects and their components separately, then reassemble them after the fact. Others capture screenshots of the pages as rendered in a browser, and may even record images of pages leading up to an error.
In other words, you get what you pay for. Ask lots of questions about how errors are captured and reported.
One of the main differences between synthetic testing vendors is whether they simulate a browser or run a real browser.
The simplest way to run an HTTP test is to do so through a
script. When you open a command line and use telnet to connect to port 80, you’re
simulating a browser, and you get an answer. Emulating a browser by
sending HTTP requests and parsing the responses is an efficient way to
perform many tests by simply writing scripts.
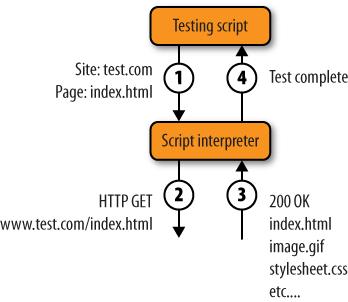
Many lower-end testing services rely on this browser simulation approach, shown in Figure 9-18.
The test service creates simple instructions containing lists of sites and pages.
The script interpreter builds properly formed HTTP requests that it sends to the server.
The test service examines the resulting responses.
The service pronounces the test finished.
While browser simulation is straightforward and consumes few resources on the testing machine, it has important limitations that a second approach—using actual browsers—doesn’t face.
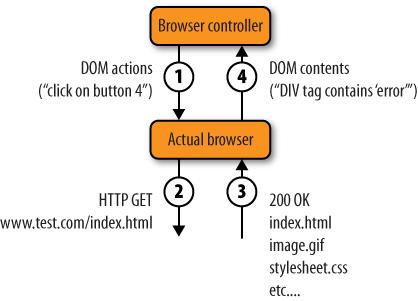
The other main way to run tests is by manipulating an actual copy of a web browser, illustrated in Figure 9-19, which we call browser puppetry.
Instead of sending
GET
            index.html
, the script tells the browser, “Click on the fourth button.”The browser then performs the action, which results in a message to the server.
The next page is loaded.
The script can then examine the browser’s DOM to determine whether the request worked.
This is much more burdensome for the testing service (it must run thousands of actual browsers in memory on its testing platform), but the benefits are significant:
In a puppetry model, the service can examine all elements of the user experience, including things like text in the status bar, or cookies, by looking at the DOM, rather than just parsing the server’s response.
The puppet browser will include all the headers and cookies in a request that a browser would normally send. Scripted tests require that you manually supply these headers, and also require logic to maintain cookies.
The puppet browser will automatically handle caching properly, whereas simulation will likely load all objects each time a test is run.
Forms and complex navigation are much harder to emulate with simulation than they are with a puppet browser, where the test script simply has to say, “Put value A into form B.”
The most important advantage of browser puppetry, however, comes from client-side content. In many modern web pages, JavaScript within the page dynamically generates URLs after the page is loaded. Consider, for example, a simple script that randomly loads one of five different pictures. Each time someone visits the site, the container page loads, then JavaScript decides which image to retrieve and builds the URL for that picture.
There’s no way to know which image to retrieve without actually running the JavaScript, so this is very difficult for a simulated browser to test. With browser puppetry, the controller simply tells the browser, “Go and get this page.” The browser does so, runs the JavaScript, and picks one of the five images. For dynamic, rich websites, puppetry is the right choice.