
For as long as servers have existed, they’ve generated logfiles. Early on, these logs were just another source of diagnostic data for someone in IT. Each time a server handled a request, it wrote a single line of text to disk. This line contained only a few details about the request, and it followed the Common Log Format, or CLF. It included information about the user (where she connected from) and about the request (the date and time that it occurred, the request itself, the returned HTTP status code, and the byte length of the document or page transferred).
It was only in the mid-1990s that information such as user agents (the browser) and referrer (where a user came from) was added to logfiles. A slightly more detailed version of HTTP records, known as Extended Log Format (ELF), followed in early 1996. ELF added more client and server information.
ELF gave many companies their first glimpse of what was happening on their websites. Web logs were sparse, and focused on the technical side of the web server: which objects were requested, which clients requested them, when they were retrieved, and the HTTP status codes in response to those requests.
At first, web operators parsed these logfiles to find problems, searching for a specific error such as a “404 not found,” which indicated a missing file. They quickly realized, however, that they also wanted aggregate data from the logs, such as how many requests the servers had handled that day.
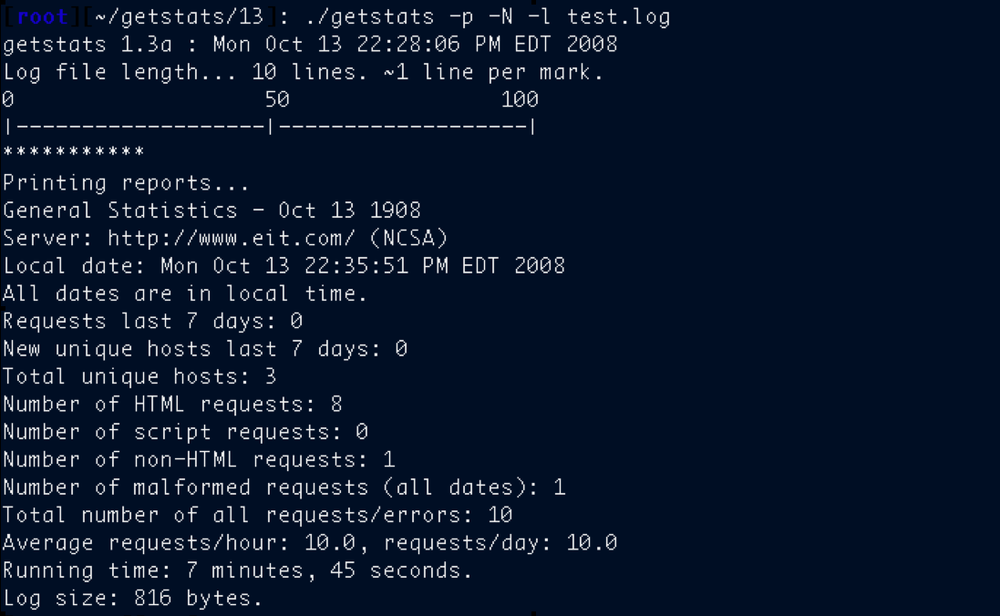
So coders like Kevin Hughes developed applications like GetStats, shown in Figure 5-1, that would “crunch” logs and display the results in a more consumable format.
Before web analytics became interesting to marketers, however, several things had to happen:
The Web had to become mainstream enough for marketers to care, requiring both a large number of connected consumers and a rich visual experience within web browsers. Clearly, this has happened: there were only 38 million Internet users in 1994, but roughly 1.5 billion by January 2009—a 40-fold increase (http://www.internetworldstats.com/stats.htm).
Analytics had to become visitor-centric. To be useful for business, logging had to move from individual requests for pages to user visits so that something a user did on page A could be linked to a purchase on page F. Cookies made this possible and added unprecedented accountability to promotional campaigns.
Analysts needed ways to segment visitors so they could decide which browsers, campaigns, promotions, countries, or referring sites were producing the best business results, and optimize their websites accordingly. Better logging and access to browser data offered good segmentation, which meant that analysts could act on what they saw through experimentation.
By the mid-1990s, established brands were launching their web presence. Secure Sockets Layer (SSL) made it safe to conduct transactions, and companies like Pizza Hut, CDNow, and Amazon were selling real things to real customers through web interfaces. The audiences were there, too: the 1998 World Cup website france98.com served, on average, 180 requests a second between April 30 and July 26, for a total of 1.3 billion requests.
Web analytics companies like Accrue, NetGenesis, and WebTrends started to process web logs in ways marketing, rather than IT, wanted. This was big-ticket enterprise software, consisting of large up-front licenses and powerful servers on which to run it. This software got its data from logfiles or by sniffing web hits directly from the Internet connection, which meant that IT still had to be involved in the deployment process, and that the company had to maintain servers and storage to collect and analyze all of the data.
Technologists were less and less the audience for the data produced by these tools. Instead, their features focused on marketers eager to embrace their online customers who were clamoring for more insight into what was happening online.
In many companies, something important changes when marketing departments become the customer. Operations is traditionally a cost center—the tools it uses are seen as ways to minimize costs—but the marketing department’s tools are about maximizing revenue. Marketing makes it cool.
Three important changes placed analytics firmly in the hands of marketing.
As marketers took over web analytics, they wanted ways to monitor their websites without having to ask IT for permission to do so. JavaScript made it possible to collect visitor activity without installing servers or parsing web logs. Marketers were free from the tyranny of IT operators.
In 1996, San Diego-based company Urchin launched a hosted analytics service called Quantified. At the same time, a company in Salt Lake City called Omniture introduced a similar analytics tool, SiteCatalyst, which was focused on large enterprises.
That year, at Stanford University, two students were working on an algorithm for measuring the importance of pages that would eventually change the way the world found information. Google—and other search engines and directories—spawned an ecosystem of advertisers, buyers, and analysts by selling advertising space alongside search results. The result was a thriving online advertising industry that was cheaper and more accountable than its offline counterpart.
Online ads could be changed at a moment’s notice—after all, they were just information. They were also completely trackable. Consequently, marketers could test and adjust campaigns, bidding on the search terms that were most likely to drive buyers to their sites. This changed the kinds of reports analysts wanted. Suddenly, it was all about which campaigns and referring sites were most likely to attract visitors that would complete transactions.
Third-party analytics services enjoyed better economies of scale than individual enterprises could achieve on their own. An analytics service had enough capacity to handle traffic spikes to one individual site, amortizing the analytics processing across machines shared by all customers. Marketers paid for the traffic they measured, not the up-front cost of servers and software.
Now that analytics belonged to the marketing department, billing was tied to revenue rather than cost. Analytics was paid for as a percentage of web revenues. If traffic increased, a company’s monthly analytics bill increased—but so (hopefully) did its revenues.
Around this time, the web analytics industry became much more mature, urged on by people like Jim Sterne (who launched the web analytics conference “eMetrics”), Matt Cutler, Jim Novo, and Bryan Eisenberg (who founded the Web Analytics Association). Other industry thought leaders would later emerge, such as Eric T. Peterson and Avinash Kaushik. We also saw the first steps toward standardization of terms, metrics, and reports.
While early web analytics reports simply counted HTTP requests, or hits, marketers quickly learned that hits were misleading for several important reasons:
The number of hits varies by page. Some pages have dozens of objects, while others have only one object.
The number of hits varies by visitor. First-time visitors to a site won’t have any of the graphical content cached on their browsers, so they may generate more hits.
It’s hard to translate hits to pages. Pages may have JavaScript activity that triggers additional requests. A Google Maps visit, for example, triggers hundreds of hits on a single page as a user drags the map around.
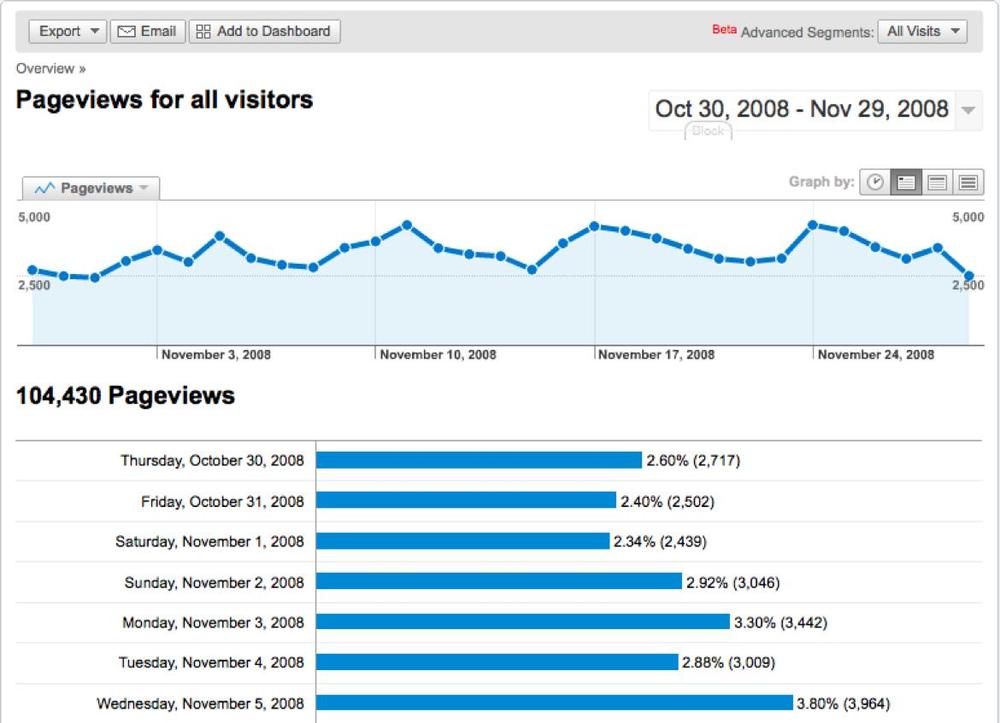
The first useful web analytics metric is the page view, which is a measure of how many pages visitors viewed. A page view report like the one in Figure 5-2 shows you how many times a visitor saw a page of your site.
Page views are still misleading. If your site serves 100 pages, you don’t know whether the traffic resulted from a single visitor reading a lot of content or a hundred visitors reading one page each. To deal with this, web analytics started to look at user visits with metrics like unique page views, which ignored repeated page views by the same visitor.
One of the main ways in which websites distinguish individual visitors from one another is through the use of cookies—small strings of text that are stored on the browser between visits. Cookies are also a major source of privacy concern because they can be used to identify a visitor across visits, and sometimes across websites, without the visitor’s explicit approval.
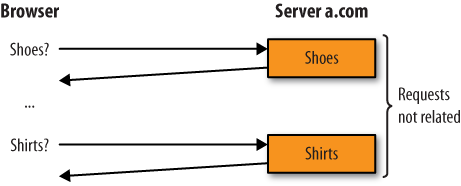
In the very early days of the Web, each request for content stood alone—two requests from the same visitor weren’t related. If a user asked for a page about shoes and then moved on to a page about shirts, those appeared to be completely independent requests. This severely limited the usefulness of web applications. You couldn’t, for example, put items in a shopping cart; each item looked like an entirely new request, as illustrated in Figure 5-3.
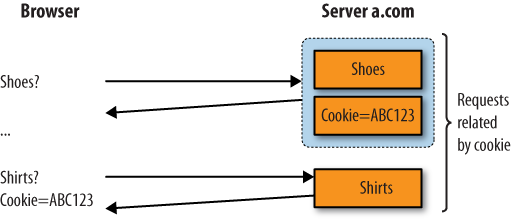
To address this issue, websites started sending cookies to browsers. A cookie is a unique text string that a web server sends to the browser when a user first visits. Each time the user returns or requests another page on the site (with the same browser), it passes the cookie to the server, as shown in Figure 5-4. Because of this, cookies let website operators know which pages they’ve shown to users in the past.
A cookie contains long strings of data that aren’t supposed to be personally identifiable. (we’re using the phrase “supposed to be” because it is technically possible for a website operator to place personally identifiable information inside a cookie—and it happens surprisingly often). In fact, cookies are often encrypted, changed, and updated by the server during a visit. A site cookie also isn’t shared: the browser only sends the cookie to the site it got it from in the first place. This means that a cookie can’t be used to track a user across several web properties. Figure 5-5 shows the use of a second cookie, this time on site b.com, that is completely unrelated to the cookie sent by site a.com.
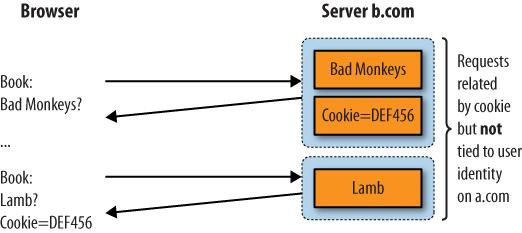
Figure 5-5. The visitor in Figure 5-4 visits a bookstore (b.com) that’s unrelated to the previous server, and gets a new—and different—cookie
Or at least that was the plan.
In Figures 5-4 and 5-5, visitors received two cookies, one from each visit. Consider what happens, however, if those sites serve advertisements from a shared ad network, as shown in Figure 5-6. When a user retrieves an ad on a.com, then moves to b.com (whose ads are being provided by the same ad network), the ad provider now knows that the two visits are related.
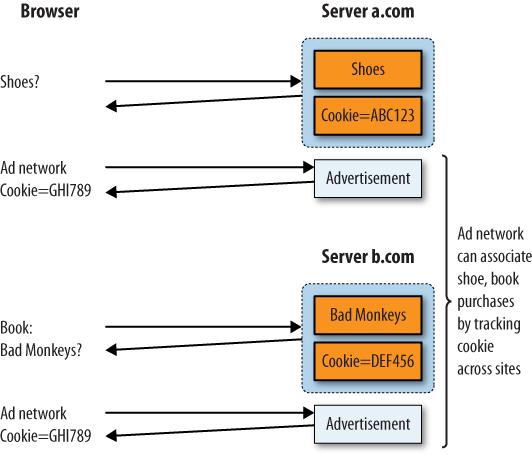
These “tracking cookies” let an advertiser track an individual across many sites, and some consider them a violation of privacy.
Let’s be clear about this: the use of cookies means that if you view an ad on a server with adult content on Monday, then visit a bookstore containing ads from the same ad provider on Tuesday, the ad provider could, in theory, tie the two visits together. When tracking cookies are tied to personal information, such as your bookstore account, the risks are even higher.
In practice, this doesn’t happen much—perhaps because of strikingly different ad content—but it’s the reason for the public outcry when sites like Facebook try to implement visitor tracking as part of their advertising systems.
On the other hand, cookies make it possible to tie together requests for several pages into a web visit from an individual, making them essential for web analytics.
Note
There are other ways to tie together page requests, including Uniform Resource Identifier (URI) parameters and hidden form elements. Some sites resort to these when a visitor’s browser blocks cookies. These are less likely to cause privacy violations because they’re not stored on a browser across visits while still allowing a website to stitch together the pages of a user’s visit and keep track of things like shopping carts.
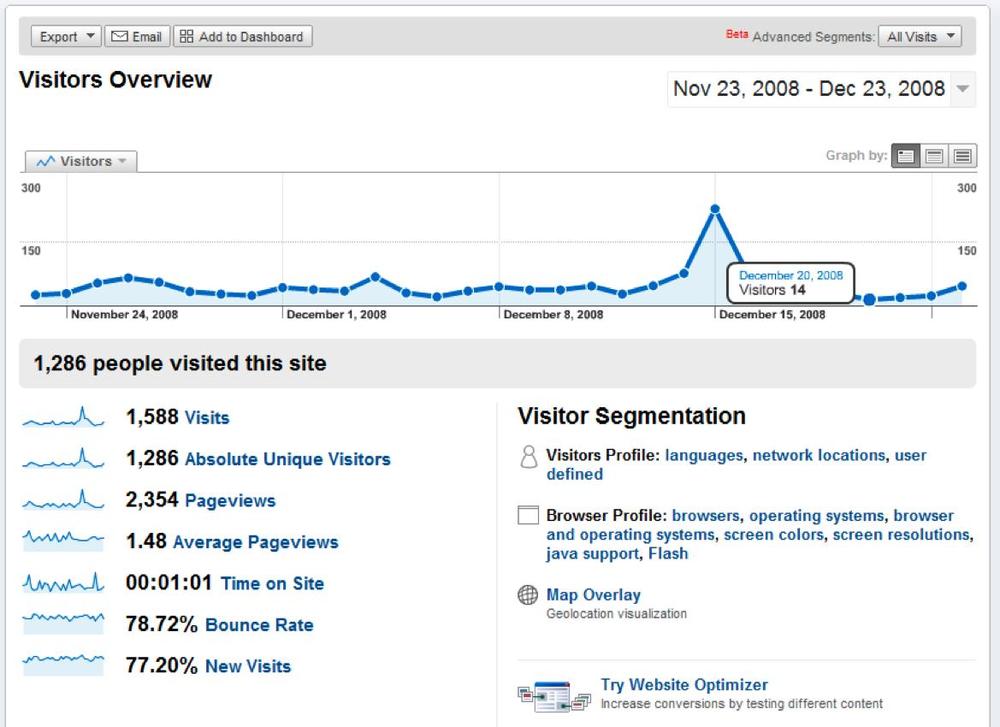
Visitor analysis, such as that shown in Figure 5-7, makes it possible to calculate other data, such as bounce rate (how many people left after seeing only one page), and how many pages a typical visitor looked at. Tracking visits also means we can now see where visitors came from and where they went.
A visitor’s page views are simply steps toward a goal or an outcome. It’s these outcomes—not page views—that make your business work. After all, a user who comes to the site and buys something quickly generates far fewer page views but is much better for business than someone who browses around for a while before leaving without buying anything.
Tracking visits by outcome lets you make smarter decisions about your website. For example, if you simply analyze visits to your site based on where visitors came from, you’ll see which sites are driving traffic to you, as shown in Figure 5-8.
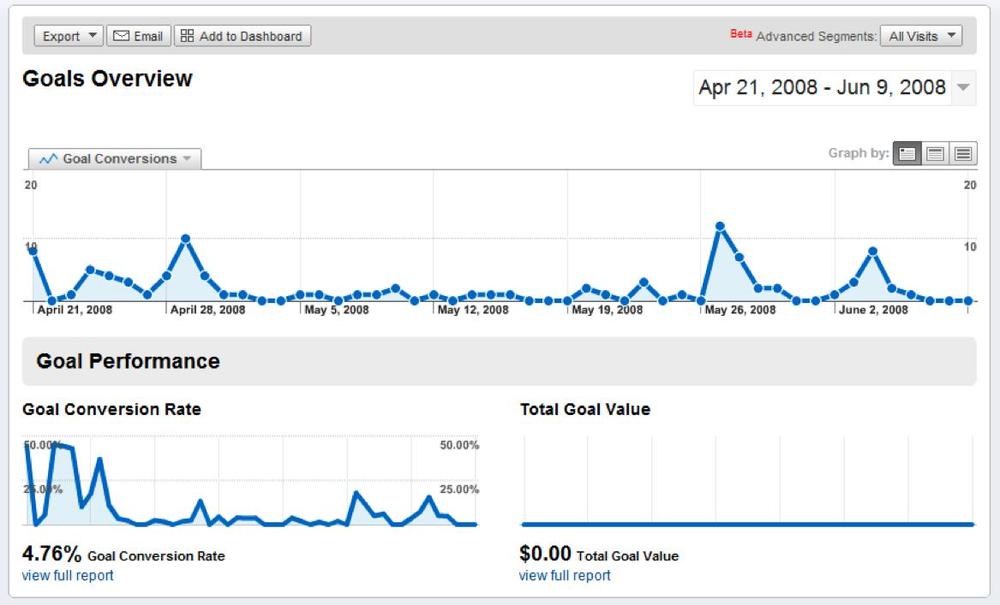
Now suppose that you have a specific goal, such as having visitors fill out surveys on your website. You can analyze how many people completed that goal over time and measure the success of your business in a report like the one shown in Figure 5-9.
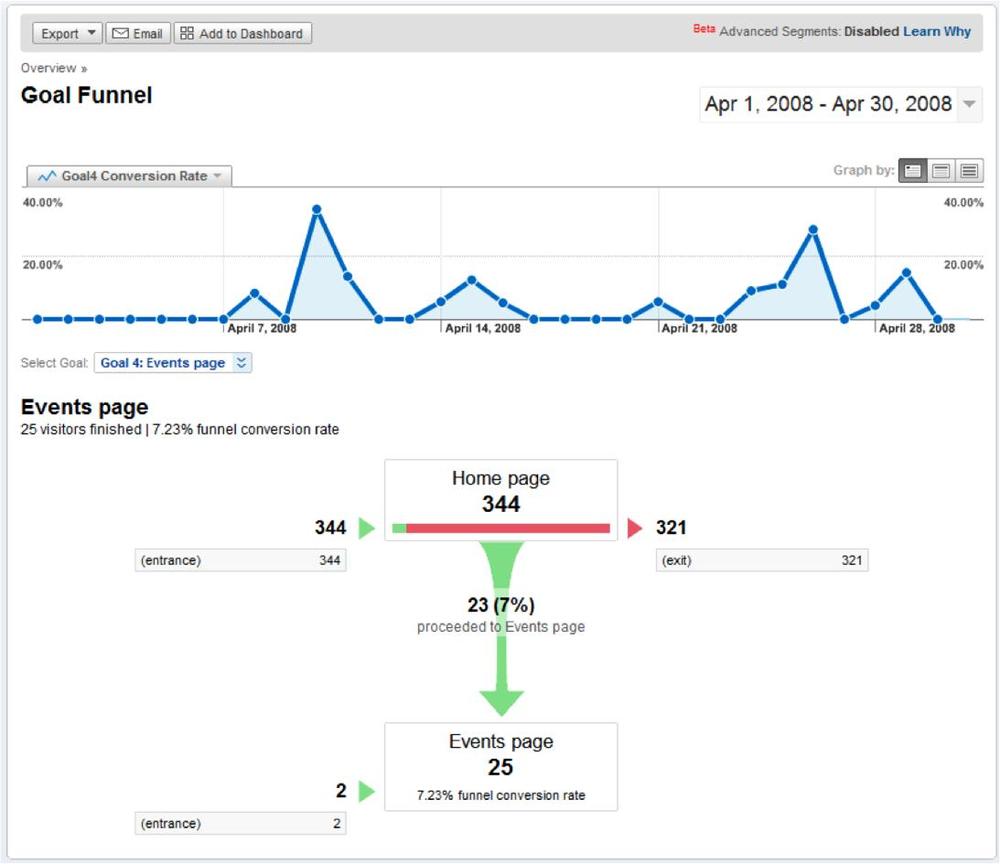
Goals and outcomes are essential. If you don’t have a goal in mind, you can’t optimize your site to encourage behaviors that lead to that goal. We typically express the steps a visitor takes towards a goal with a “funnel” like the one shown in Figure 5-10, indicating how many visitors proceeded through several steps and how many abandoned the process.
Funnels are a good way to depict where people are coming from and where they’re abandoning a process. However, goals provide more than just accounting for conversions; they let you focus on what’s working through segmentation.
Not all traffic is the same. Consider the list of sites that sent you traffic (in Figure 5-8). By segmenting those referring websites by goals, rather than just by total visits, you can see which of them sent you visitors who mattered—the ones that achieved the goals you hoped they would.
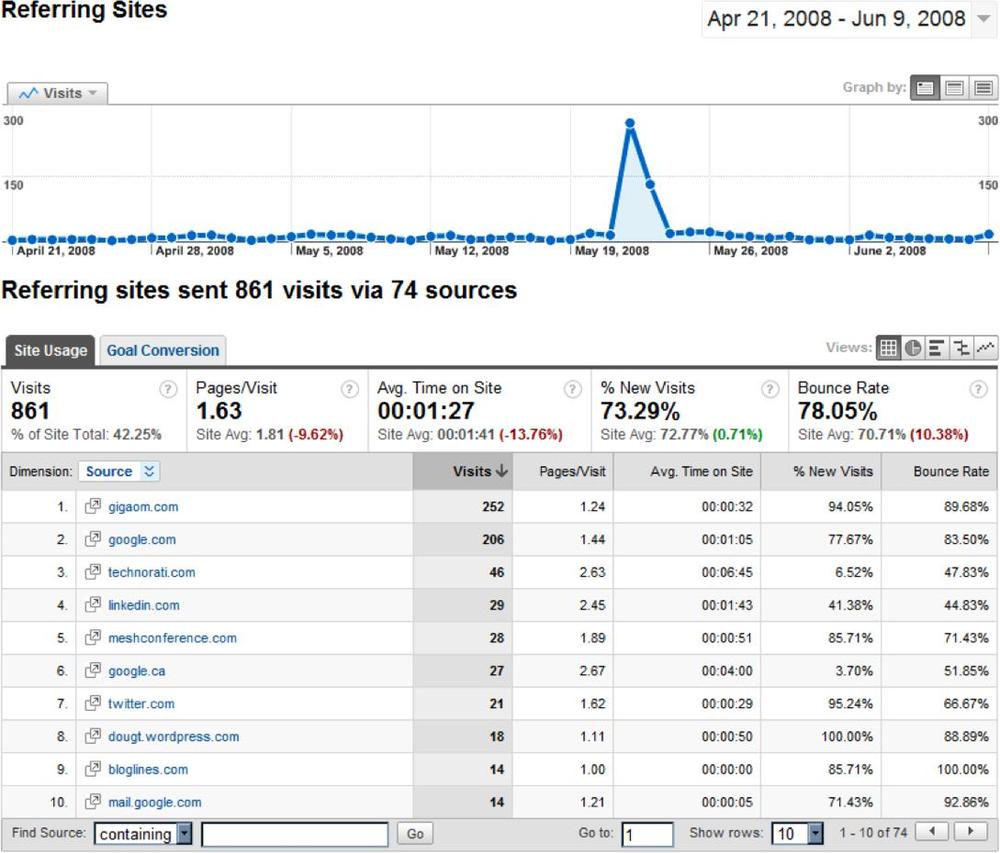
Referring sites that sent you large amounts of traffic may not have contributed to goals, while those who sent only a small fraction may have contributed significantly, as is the case here. From reports like the one shown in Figure 5-11, you can make the right decisions about where to focus your promotions.
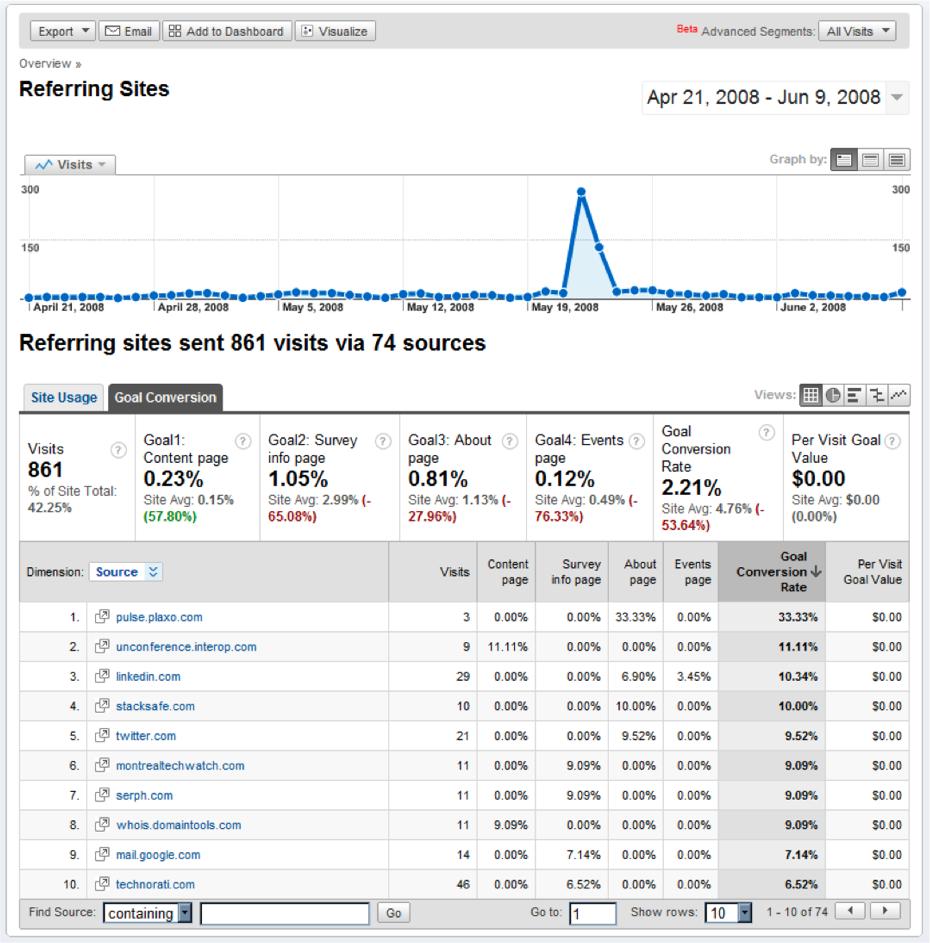
Figure 5-11. The list of referring sites, this time segmented by goal conversion rate, shows which referring sites contributed to your business the most
Segmentation goes far beyond just measuring the effectiveness of referring sites. You can segment by anything that your analytics tool collects.
Early analytics tools were limited in what they could capture, however. What if you wanted to understand whether people who bought shoes also bought jackets? Or whether platinum members were more likely to comment on a post? Marketers needed a way to embed more context into their pages so they could segment in better ways. They needed page tagging.
In the previous examples, we knew the goal we wanted visitors to accomplish (the “about” page), and we knew the various sites that were sending us traffic. The referring site is part of the default data an analytics tool collects. To add more context to a visit, we need to embed meaning in the page that the analytics system can later extract. This is called page tagging, and to understand it, we need to look briefly at how browser instrumentation works.
Figure 5-12 illustrates how JavaScript-based analytics systems collect page hits from a visitor.
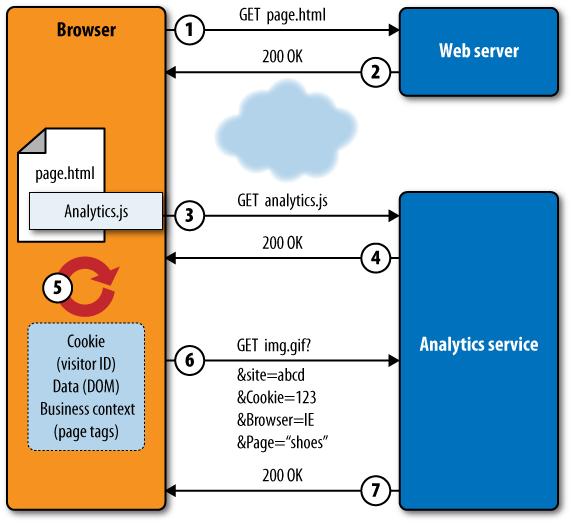
The browser requests a page from the web server.
The web server returns the page, which contains a reference to a piece of JavaScript provided by the analytics service.
The JavaScript is retrieved from the service. In some cases, it may already be cached on the browser or built into the page itself.
The analytics service returns the JavaScript to the browser.
The browser executes the JavaScript, which collects information about the page request.
The JavaScript puts this information into an HTTP request, often for a tiny image. All of these attributes are sent to the analytics service.
The service responds with a small object (which can be ignored).
We’ll return to this topic later in the chapter when we consider implementation.
The magic of page tagging happens in step 5, in which the JavaScript collects information to send back to the analytics service. This information includes:
Information about the technical environment, such as screen resolution, referring URL, or operating system.
Information about the visitor, such as a cookie that uniquely identifies her and lets the analytics service stitch several pages together into a visit.
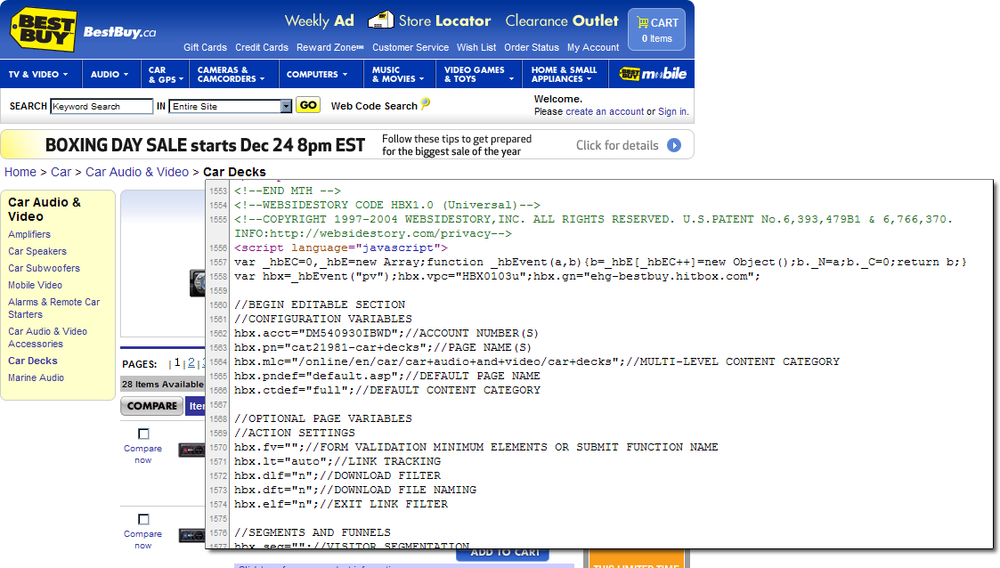
Information within the page itself that provides business context. For example, a retailer might tag a page with “shoes” if it offers shoes for sale. Or it might indicate whether the ad the user saw was part of a specific campaign. Figure 5-13 shows an example of page tags on a retail website.
By recording not only technical data on the visit, but also business context, the analyst can then segment outcomes with this context. He can see whether one campaign works better than another, or whether users who buy shoes ultimately buy jackets.
Notice how far we’ve come from the early days of analytics, in which IT teams looked at hits to measure capacity? Today, web analytics is a marketing discipline used to measure the effectiveness of communications strategies.
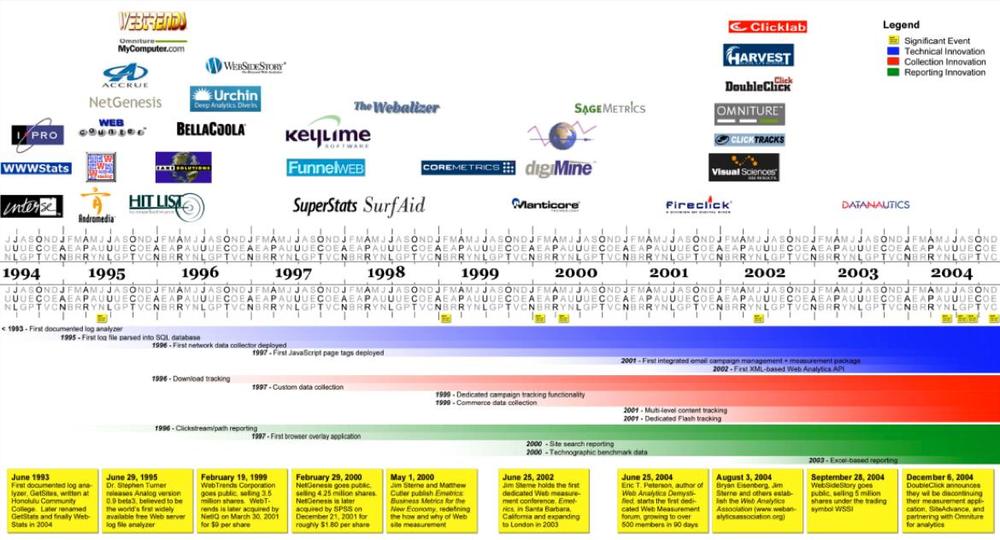
It’s also a full-time job, with large organizations often having entire departments devoted to tagging, experimentation, and reporting. A history of web analytics, compiled by the Yahoo! web analytics mailing group as a result of discussions by Eric T. Peterson and John Pestana, is illustrated in Figure 5-14.
Analytics is still changing, particularly around the integration of other data sources and around the move away from page-centric websites.
Having moved so far from their technical roots, marketers are now realizing that there’s more to user experience than just analytics, and that they need to bring other data sources into the fold if they’re going to optimize their websites.
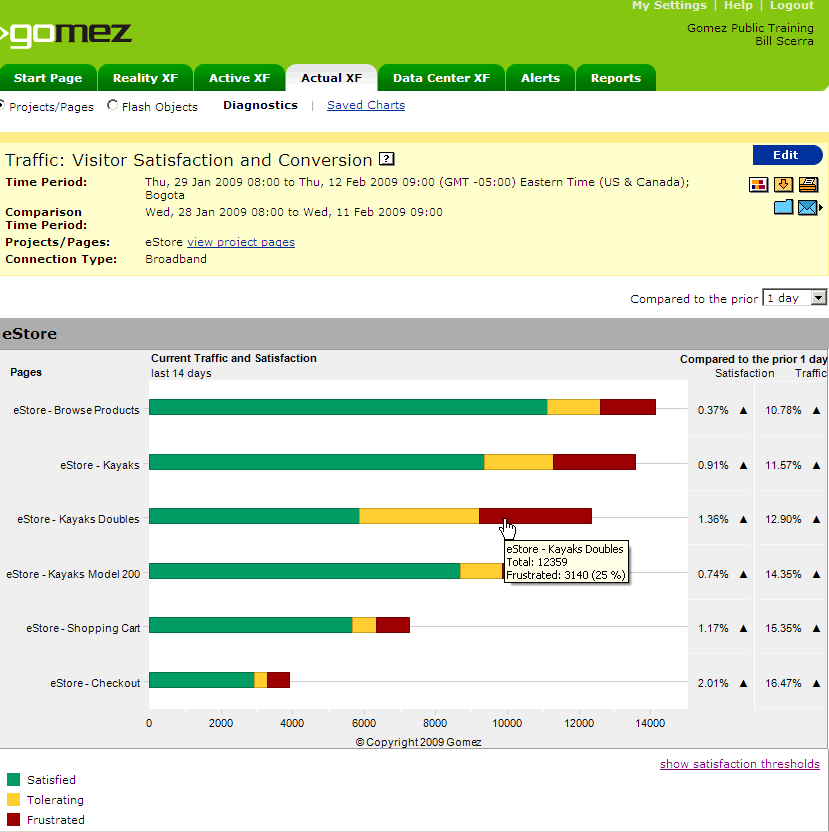
Poor performance undermines user productivity, reduces conversion rates, and discourages visitors from sticking around. Marketers care about the effect performance has on conversion. Figure 5-15 shows an example of a conversion funnel that considers end user performance.
Visitors have lots on their minds, and marketers ignore it at their own peril. It’s easy to survey customers and solicit feedback, so companies are starting to integrate VOC data or page rankings with visits and goals, as shown in Figure 5-16.
Usability has a huge impact on conversion rates, so websites are trying to identify bottlenecks and usability issues at each step of a conversion funnel, like the one shown in Figure 5-17, to optimize their sites and improve user experience.
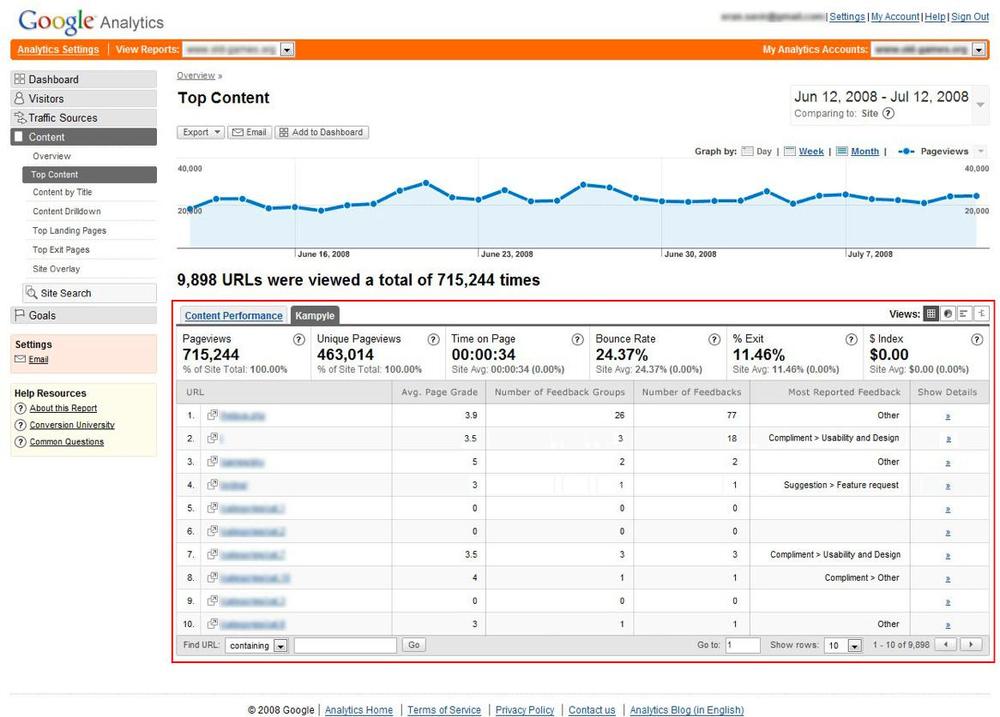
Figure 5-16. Blending visitor survey and feedback information with analytics data using Kampyle and Google Analytics
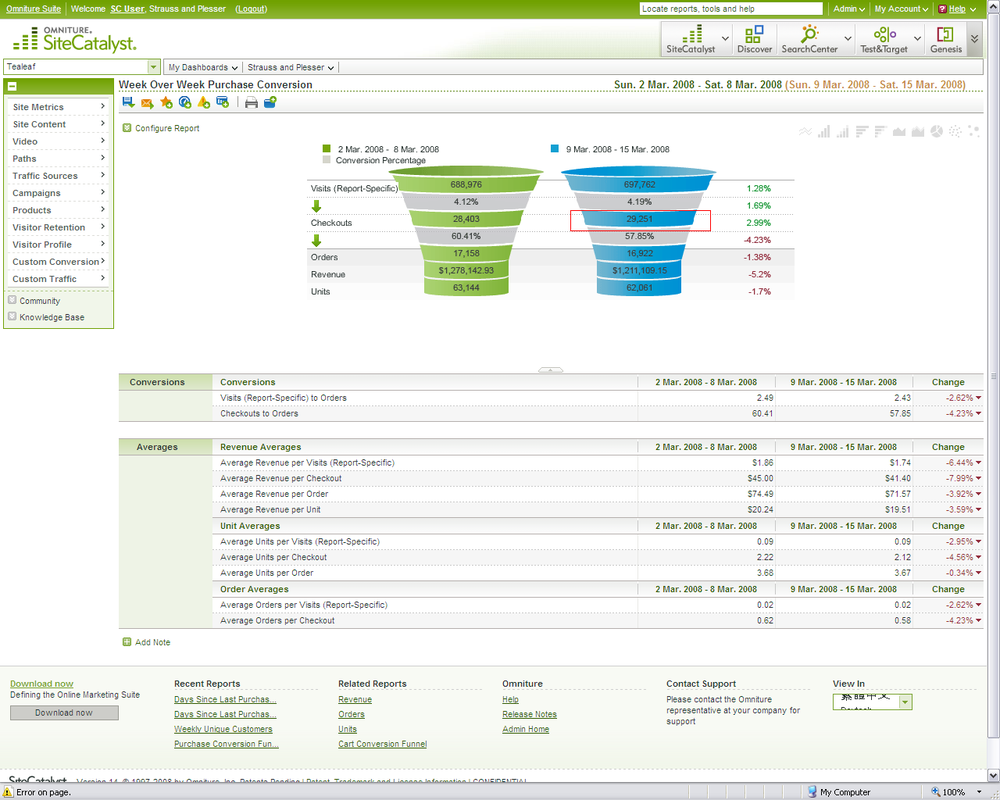
Figure 5-17. A conversion funnel in Omniture’s SiteCatalyst linking to Tealeaf in order to analyze and replay visits to understand visitor behavior
Making sense of all this information means tying it back to the business context of web analytics. As a result, we’re seeing significant advances in web visibility, particularly in the area of data integration for web analytics platforms.
At the same time that analysts are integrating performance, visitor opinion, and usability data, the nature of websites is changing. Developers are using programming built into the pages themselves in the form of Ajax-based JavaScript, Flash, Java, and Silverlight, resulting in fewer pages but more actions within a page. Some websites take this to the extreme, consisting of just a rich application embedded in a single web page.
For these sites, the old paradigm of a visitor navigating through several pages toward a goal is no longer accurate. Analytics tools need to adjust what they capture and how they record it accordingly, because not all websites follow the page-centric model on which web analytics was conceived.
Instead of thinking of websites as made up of pages, think of them as a set of “places” and “tasks.” Some of the time, users are in a “place”—they’re exploring, browsing, and interacting. Occasionally, they’ll undertake a “task”—a series of steps toward a goal. They may complete or abandon that task. This is a generalization that works for both page-centric and RIA-based (rich Internet application) websites.
Thinking in terms of places and tasks helps you to understand which outcomes you need to focus on across your entire web business.
On reddit, a list of submissions from others, ranked by popularity, is a place. Visitors can perform a series of small actions like opening linked stories in new tags, or voting things up and down. Similarly, on Wikipedia, a subject entry is a place. In Google Apps, a spreadsheet is a place.
When a user’s in a place, you care about his productivity—whether the experience was efficient and satisfying. On reddit, are users able to vote submissions up or down smoothly? On Wikipedia, can they scroll through entries easily and find what they’re looking for, and do images load? On Google Apps, are they successfully building business projections in that spreadsheet?
You still need to pay attention to abandonment, which happens when a user gets bored doing something and goes elsewhere. But in the case of a place, it’s abandonment due to boredom, satisfaction, or disinterest, not due to an inability to accomplish something.
By contrast, a task is something the user sets out to accomplish. A task comprises several steps, and puts the visitor in a different mental state. Tasks are goal-oriented. On reddit, this is a user creating an account for himself or submitting a new link. On Wikipedia, it’s a visitor deciding to edit a page. On Google Apps, it’s the employee sharing her spreadsheet with someone.
When a user’s trying to accomplish a task, we care about effectiveness—whether the task was completed successfully or not. Did the invite result in a new enrollment? Did the user complete the purchase? Was the edit of the article ultimately saved? Was the user able to add the widget to her dashboard? Did the spreadsheet’s recipient receive it successfully? When visitors abandon tasks, it’s because they ran into a problem. Something was too costly, or confusing, or violated their privacy, or dampened their enthusiasm for the job.
Looking at websites as collections of places and tasks reveals the limitations of page-centric, funnel-minded web analytics.
For one thing, you realize that you need to instrument places and tasks very differently. Places need analysis of actions within the place. How many videos did he watch? How often did he pause them? Did he see the ad? How many entries can she complete an hour? On the other hand, tasks need analysis of progress toward an outcome. Did she send the invite? How far in the form did she get? Which steps took the longest?
To further complicate matters, tasks often involve steps beyond the view of analytics, such as e-mail invitations, instant messages, RSS feeds, and third-party sites. We also want to know other things about tasks. Did the message bounce? Did the invitation’s recipient act on it?
Tracking the accomplishment of a task across multiple systems is a challenge, with all manner of tracking cookies, dynamic URLs, and embedded GIFs used to try and follow the task to completion. As outlined in http://analytics.blogspot.com/2009/02/two-cool-integrations-telephone-leads.html, some companies coordinate analytics data with offsite goal completion such as phone calls or instant messages. For more information on multichannel monitoring, see www.kaushik.net/avinash/2008/07/tracking-offline-conversions-hope-seven-best-practices-bonus-tips.html.
Most web operators have a mental map of their sites. Some even draw it on a wall. You can map out a site, consisting of places and tasks, in this way.
For each place, make a note of all the events you care about, including timing events (“a video starts playing”) and user interactions (“user upvotes and the button’s color changes”). Focus on visitor productivity and time spent in the place. Identify the actions that initiate a task (such as “share this spreadsheet”), taking the user out of the place.
For each task, make a note of all the steps you want to track, including those that aren’t on your site. Identify the key metrics you should know (in a mailout, this might be bounce rate, open rate, and click rate.) Focus on conversions, abandonments, and their causes across multiple channels.
The end result is a much more accurate representation of the ebb and flow of your online business. It will probably reveal significant gaps in your web visibility strategy, too, but at least you’ll now know where your blind spots are.
The next time you’re presenting your web monitoring results, overlay them on the map of places and tasks that you’ve made. For each place or task, show the analytics (what the users did) and the user experience (whether they could do it). If you have psychographic information (why they did it) such as surveys, or usability metrics (how they did it), include that as well. Also build in any external metrics like mail bounce rates or Facebook group member count.
We’ll return to the concept of places and tasks, and web performance considerations for both, when we look at measuring end user experience later in the book.