
Measuring arrivals, visitor activity, and departures is the lifeblood of a web business. Without this information, you can’t make smart decisions about your content, marketing, or business model. You can collect basic analytics data, such as bounce rate and visits, with just a few minutes’ work.
More advanced deployment—tracking goals, building custom segments, and tagging content—takes work, however. And if you want to use analytics for accounting data (such as daily orders) as well as for site optimization, you’ll probably have to work with the development team to extract additional information from backend databases.
There are free (or cheap) analytics solutions from the big advertising vendors, and Google Analytics has done a tremendous amount to make web operators aware of analytics.
Whatever you’re doing, your implementation will have six basic steps:
Defining your site’s goals
Setting up data capture
Setting up filtering
Identifying segments by which to analyze goals
Tagging page content
Verifying that everything is working
Let’s look at the steps you’ll need to take to implement web analytics.
Your first step is to understand and map out your web business.
That might sound like a platitude, but it’s an essential step in the process. Grab a whiteboard and some markers, and draw out your site using the places-and-tasks model outlined above. In each place, list what makes a visitor “productive.” For each task, identify the steps a visitor needs to take to accomplish the task, and the metrics you need to collect in order to track those steps.
Now go through the tasks and see which ones drive your business (this will depend heavily on which of the four kinds of sites you’re running). Each of these tasks will become a goal funnel in your analytics system, and you should try to assign a monetary value to each goal, even if it’s something as simple as “getting contact information.”
Once you’ve identified the important places and tasks, list the assumptions you’re making. Somewhere in your business model, you’re assuming that a certain number of visitors perform a given task. Write this number down; if you don’t know what it is, guess. Do the same thing for every assumption you’re making—how many people will exit from a particular place, how many will be referred by a particular kind of site, and so on.
You’ll quickly realize that there are other things you’d like to know. How long does a place take to refresh? What do visitors think of this content? Where in the form do visitors leave? Did the email invitation bounce? You can collect all of these metrics—though sometimes you’ll need third-party tools or coding to collect them. In the long term, you should try to integrate these metrics into a single, comprehensive view. For now, however, let’s stick with simple web analytics. We’ll come back to other kinds of monitoring later in the book.
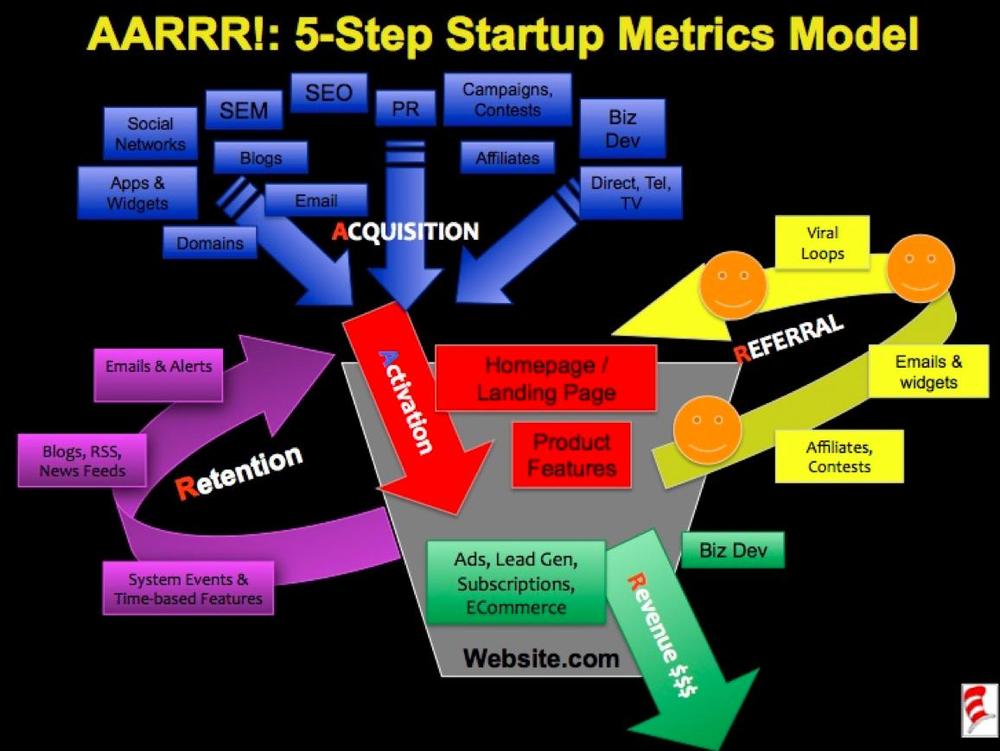
If you need some inspiration for your places and tasks, particularly if you’re running a web startup, check out Dave McClure’s “Startup Metrics for Pirates – AARRR!” at www.slideshare.net/Startonomics/startup-metrics-for-pirates-presentation.
McClure’s model, shown in Figure 5-37, shows the many sources from which traffic can arrive (acquisition, retention, and referral), the places within the site (activation), and the tasks visitors can perform, such as enrollment (retention), inviting others (referral), and spending money (revenue). It provides a valuable starting point for thinking about your web business.
Notice that you don’t need a web analytics account yet—you’re still nailing down the really important question: what is my site trying to encourage people to do? Set aside a day for this process—it’s a lot of work that often involves a surprising number of people in the company. Mapping your site is a time-consuming and iterative process; if it seems too daunting, pick a subset of the site at first, such as a particular application or a certain domain.
Once you know which metrics you want to collect for each place and task on your site, you need to define them within the analytics package you’re using.
You don’t need to configure monitoring of places much, since the default analytics metrics, like bounce rate, time on page, and page views tell you most of what you need to know. If users can perform simple on-page actions, such as upvoting submissions or paginating through content, you may need to record these in-page actions with your analytics tool.
When it comes to monitoring tasks, simply tell the analytics tool what the “goal” page is—for example, a payment confirmation screen—and the pages leading up to that goal.
Now that you know what you want to capture, it’s time to set up the analytics system. There are several ways to deploy web analytics, from server logs to JavaScript-based collection.
ELF files that web servers generate contain a limited amount of data, but if you’re running a website behind a firewall or have specific privacy restrictions, they may be your best and only source of visitor information.
Popular web servers like Apache httpd and Microsoft IIS generate ELF-formatted logs (shown in Figure 5-38). These logs contain text strings, separated by spaces, that analytics tools import and reassemble into page requests and user visits.
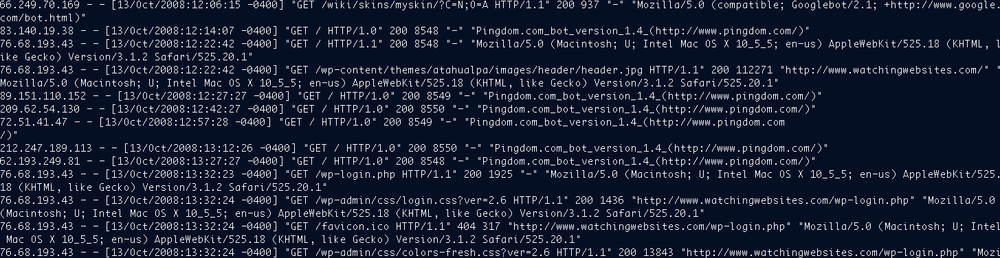
Here’s an example of a single hit recorded in an Apache server log:
10.100.3.200 - - [28/Mar/2009:11:50:55 -0400] "GET
  / HTTP/1.1" 200 53785 "http://twitter.com/seanpower"
  "Mozilla/5.0 (Windows; U; Windows NT 6.0; en-US; rv:1.9.0.7)
  Gecko/2009021910 Firefox/3.0.7" 125763
Here’s a similar hit recorded in a Microsoft IIS server log:
2008-08-12 20:05:34 W3SVC216049304 10.0.0.1 GET /
WebUISupportFiles/images/bg_page.gif - 80 - 10.0.0.1 Mozilla/4.0+
(compatible;+MSIE+7.0;+Windows+NT+5.1;+.NET+CLR+2.0.50727;+InfoPath.2) 200 2921
Despite some differences in formatting and extra characters, server logs from various web servers are essentially the same. Each string in these logs tells you something about the visitor. For example:
The client-ip field is the IP address of the visitor. You may be able to resolve the address to the organization to which it is registered; you can also look it up using a geolocation database to find out where the IP address is physically located.
The cs-referrer field shows the site that has referred the traffic to you.
The URI may have special information, such as a campaign identifier (for example, www.watchingwebsites.com/alnk&campaign_id=130) or other information against which you can segment visitors.
The user agent field shows information on the browser and operating system the user is running.
The HTTP status code shows errors that may have occurred in the request. However, you can’t rely too heavily on HTTP status codes—a “200 OK” message may simply indicate that an apology page was delivered correctly. We’ll look at performance and availability monitoring in Chapters 8 through 10.
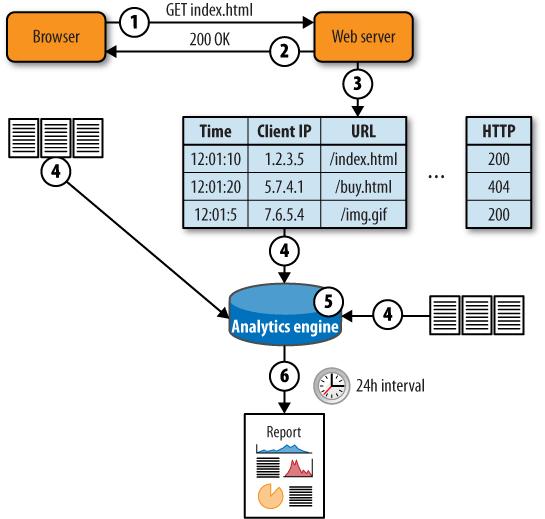
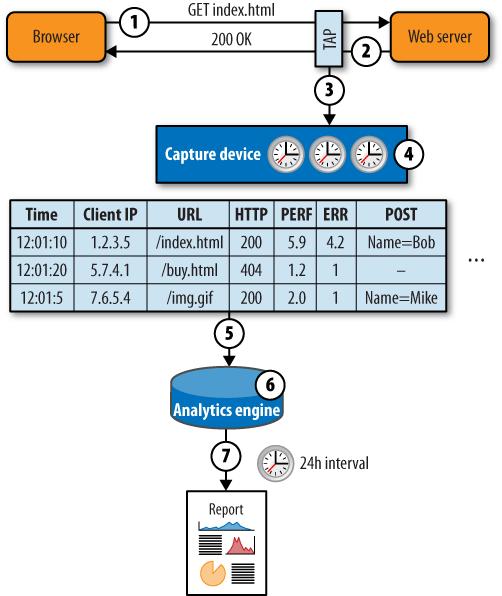
When using web logs, the analytics tool retrieves logfiles from servers at regular intervals and processes the data they contain. The system usually deletes the logfiles after parsing them. Figure 5-39 shows how logfile-based analytics work.
A visitor’s browser requests an object from the server. The browser provides a variety of data, such as referring URL and browser type, along with the request.
The web server responds with the requested object, as well as information such as object size and compression.
The web server writes a line to the logfile describing the request and response.
Logfiles from all of the web servers are copied to the analytics tool at regular intervals.
The analytics engine stores and aggregates all of the logfile data across all of the servers.
At regular intervals—often daily—the analytics engine generates a series of reports.
In more modern logfile analytics, the operator can request reports dynamically from the engine without waiting until a reporting period is complete.
Here are some of the advantages of a server log capture approach:
- Better data privacy
You own the data. You don’t need a third party, such as an analytics service, to generate reports. This lets you control where the data goes and who can see it.
- Useful for internal websites
To use a third-party analytics service, you need to be able to send data outside of your organization. If your users’ browsers can’t reach the Internet, you can’t use these services. This is particularly common for intranets and other in-house environments.
- Works when JavaScript won’t
Logs may also be useful if your visitor community doesn’t use JavaScript, since other analytics collection approaches that rely on client JavaScript won’t work. This is common with some mobile devices.
- Pages load faster
If you rely on client-side JavaScript to monitor pages, your pages will take longer to load. By analyzing logs instead, you won’t add to page delay.
- Easier to merge with other data
The server may generate additional logs that contain useful data such as CPU load or custom metrics. This data can be interleaved with HTTP requests according to timestamps. If you don’t have web server logfiles, you can’t merge these other logs with them.
There are some disadvantages, however, to relying on server logs for capture:
- Implementing them will require the efforts of more people
IT and marketing departments need to work together to deploy log-based analytics. This can mean implementation delays if analytics isn’t IT’s top priority (and it seldom is!).
- Log analysis is a lot of work
As traffic grows, the amount of processing needed to parse web logs grows alongside it. On large sites, a day’s web logs can consume hundreds of megabytes. Logging every request can also consume precious server resources, slowing down the site even further when it’s busy. And if you don’t plan carefully, it can take more than a day to process a day’s web activity, meaning you’re constantly playing catch-up while your analytics get increasingly out of date.
- It may not be possible for you
Depending on your hosting environment, you may not be able to get the web server logs in order to process them.
- Limited visibility
Log-based analytics can only report what’s in the log files. Browser-side actions and information about the browser itself, such as cookies, screen resolutions, coordinates of user clicks, and so on, can’t be collected from logs. Furthermore, logfiles don’t collect POST parameter information unless it’s stored within the URI stem as parameters, which can pose a major security risk when users forward URIs to others.
Most of the web analytics industry has moved beyond web logs to client-side collection models unless they have no alternative but to use web log analysis.
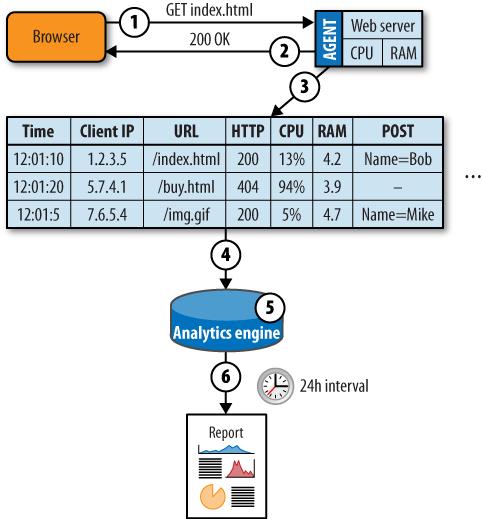
If you need more data than a web log contains, but absolutely must rely on the server itself to collect that data, you can use server agents. These are programs that run on the server and record transaction information, often with additional application context. These agents may also help with logfile collection by pushing logs to a centralized platform. Figure 5-40 shows an example of this.
A visitor’s browser requests an object from the server. The browser provides a variety of data, including referring URL and browser type, along with the request.
The web server responds with the requested object, as well as information such as object size and compression.
The agent assembles the request and response data, as well as system health metrics and other data about the environment at the time of the request, and writes a line to the logfile.
The agent massages the data it’s collected, compresses it, and passes it to a central engine for analysis. The agent may also proactively alert when it detects problems.
The analytics engine stores and aggregates all of the logfile data across all of the servers.
At regular intervals—often daily—the analytics engine generates a series of reports.
Popular web servers have well-defined interfaces to which an agent process can connect. On Apache servers, the module model (http://modules.apache.org/) allows third-party code to see each web request and the corresponding response. On Microsoft’s servers, ISAPI (the Internet Server API) provides this connectivity. Companies like Symphoniq also use agent models to capture end user and platform health simultaneously.
Modules and ISAPI extensions may not just be passive listeners in a web conversation between web clients and a server—they may also change it. Many websites use modules for content caching, filtering, and authentication. These modules can get a better understanding of a web visit and can create more verbose logs than what’s included in basic ELF.
Note
See http://www.port80software.com/products/ for some examples of server agents that provide additional visibility and control over web traffic on the server itself.
Server agents give you more insight into transactions, at the expense of more computing power and additional components you have to manage. If you collect analytics data with server agents, there are some advantages:
- Additional information
Server agents may record additional information about the health of servers (such as CPU, memory, and I/O) and request data (such as POST parameters) that is typically not collected by web servers
- Lower data collection overhead
Server agents can handle some of the aggregation, logfile compression, transfer, and decompression needed to get logs from the servers to the analytics tool. This reduces the amount of work the analytics engine needs to do in crunching log data, as well as the total volume of logfiles that need to be collected from each server.
- SSL visibility
Agents on servers are “inside” the SSL encryption boundary and can see every part of a web transaction without additional work managing SSL keys.
- Turnkey solution
For a small site running on only one machine, a server agent may act as both a collector and a reporting interface.
- Data is available, even when the service dies
Server agents may still collect data when the HTTP service itself isn’t functioning properly.
Relying on a server agent to collect data has some downsides, however.
- Use of server resources
Agents consume resources on the servers, which are better used handling requests and serving web pages.
- More things to break
Agents add another point of failure to the web servers. For sites of any size, web servers are stripped-down, single-purpose machines that have been optimized to do a few things quickly and reliably.
- No client visibility
Server agents share many of the limitations of web logs, because they don’t have visibility into the client’s environment and can’t capture important segmentation data about what happens on the client.
- Dependent on a working server
If the server stops working, so does the server agent, leaving you guessing about what went wrong.
A third approach to collection is to capture a copy of the data flowing between clients and the web server, either through the mirroring functions of a switch, load balancer, or network tap, and to use this data to re-create the HTTP requests and responses.
To do this, a network device in front of the web server cluster makes a copy of every packet, which is then reassembled into TCP sessions consisting of HTTP requests and responses. The device is usually deployed just in front of or just behind the load balancer, or on the load balancer itself. Figure 5-41 illustrates how this model works.
A visitor’s browser requests an object from the server. The browser provides a variety of data, such as referring URL and browser type, along with the request.
The web server responds with the requested object, as well as information such as object size and compression.
A passive monitoring device sends a copy of the network traffic to a collector device.
The collector device reassembles the packets into the HTTP request and response, and may also detect errors, record timing information, and extract snippets of text from the content of the response.
The collector stores this data as an augmented ELF containing all the information recorded about the transaction.
The analytics engine stores and aggregates all of the logfile data across all of the servers.
At regular intervals—often daily—the analytics engine generates a series of reports.
Passive traffic capture was an early favorite for analytics companies like Accrue, who wanted to offload work from web servers, analyze traffic destined for several servers, and get more visibility.
Capturing analytics data through a passive sniffing approach has some advantages:
- Aggregates data from many servers
Passive capture can collect many servers’ requests at once, provided they cross a single network segment.
- Captures network health information
The passive device may record information such as network timings or packet loss.
- Works when servers break
If the server dies, the device still records the circumstances surrounding that failure, as well as requests from browsers that went unanswered during an outage.
- Custom data collection
Passive capture can collect data from not only default headers, but also from the payload of a transaction (such as the dollar value of a checkout). This can be used as a substitute for some kinds of page tagging.
- No network or server delay
This kind of collection introduces no delay to the network and is quick to deploy.
- Sees all requests
Passive capture can see requests for content that doesn’t execute JavaScript, such as an RSS feed, a media object, or an Acrobat PDF.
Disadvantages of passive capture include:
- Requires data center access
A passive capture approach involves network equipment—you need physical access to the data center to deploy this kind of system and you need help from IT to deploy it.
- Requires SSL keys
Passive capture can’t sniff encrypted traffic without help. You need to install SSL keys on the sniffing equipment, which may pose a security risk.
- Problems with IP addresses
If the capture device is in front of a load balancer, it won’t see the IP addresses of the individual servers. Instead, it sees only the address of the load balancer, making it hard to tell which server handled which request without additional configuration.
- Problems with IP addresses, part two
Conversely, if the passive capture device is installed behind the load balancer, it doesn’t see the true IP address of each request, so it can’t always determine the source of traffic, making it impossible to segment by region or by domain name.
- Lack of client visibility
A passive capture device can’t see what’s happening on the browser itself, which is an increasingly important part of any application.
Because of these limitations, most passive capture tools focus on monitoring web performance and end user experience, where their insight into network performance is invaluable. Logfile generation from such devices is a side effect of how they capture data, but web analytics is seldom the main purpose of these tools.
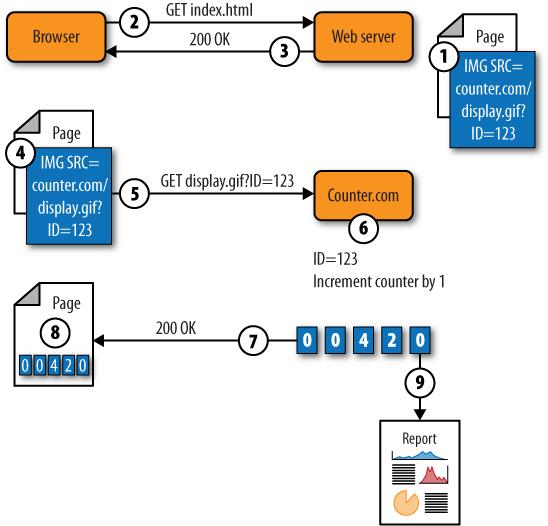
Early attempts at hosted analytics were simple: the web operator would embed a third-party object, such as a small banner or one-pixel image, in each page. Each time the page was loaded, the browser would request the small object from the third party, which would keep track of how many web requests it had seen.
Figure 5-42 illustrates this approach to collection.
The site operator embeds a reference to an image on the counter’s site. The link includes the site operator’s unique ID.
A visitor’s browser requests an object from the server. Along with that request, the browser provides a variety of data such as referring URL and browser type.
The web server responds with the page containing the image reference to the site counter.
The browser parses the page it receives and sees that it has to ask the counter site (counter.com) for an image (
display.gif).The browser requests
display.giffrom the third-party counter site, and includes the unique ID of the site that was embedded in the page.The counter site looks up the number of hits that the site with that ID had and increments it.
The counter site sends a rendered image containing the hit count back to the browser.
The browser displays the page containing the hit count.
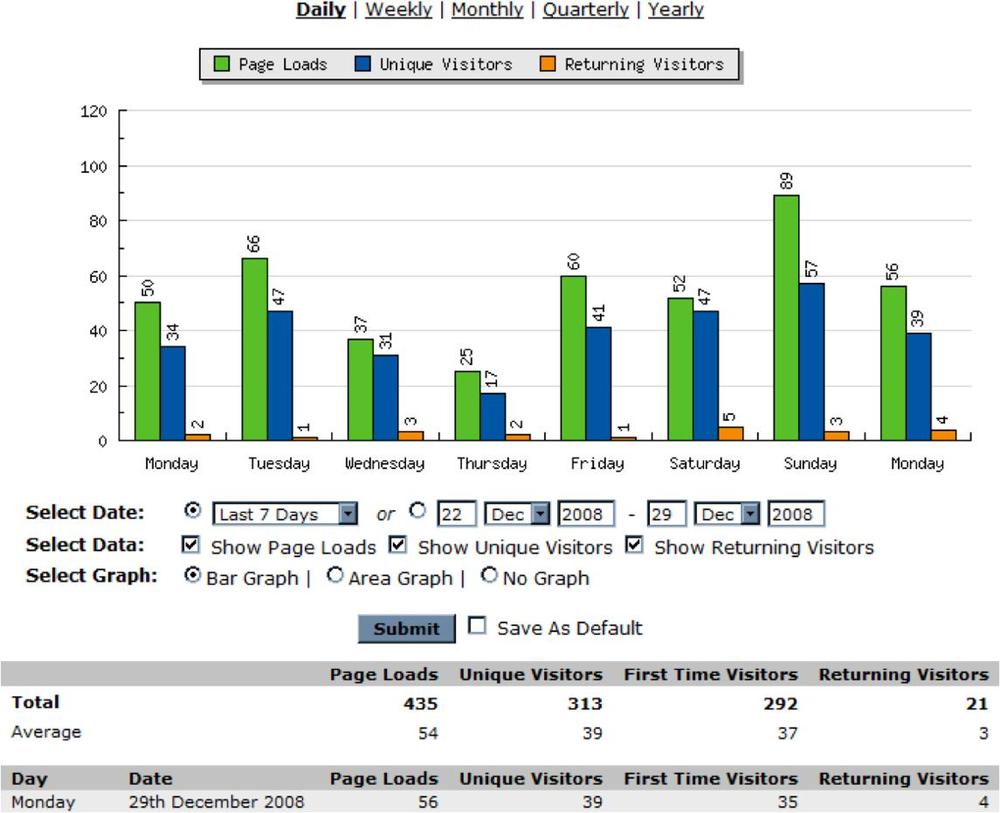
The site engine may also offer reports on traffic volumes, like the one in Figure 5-43.
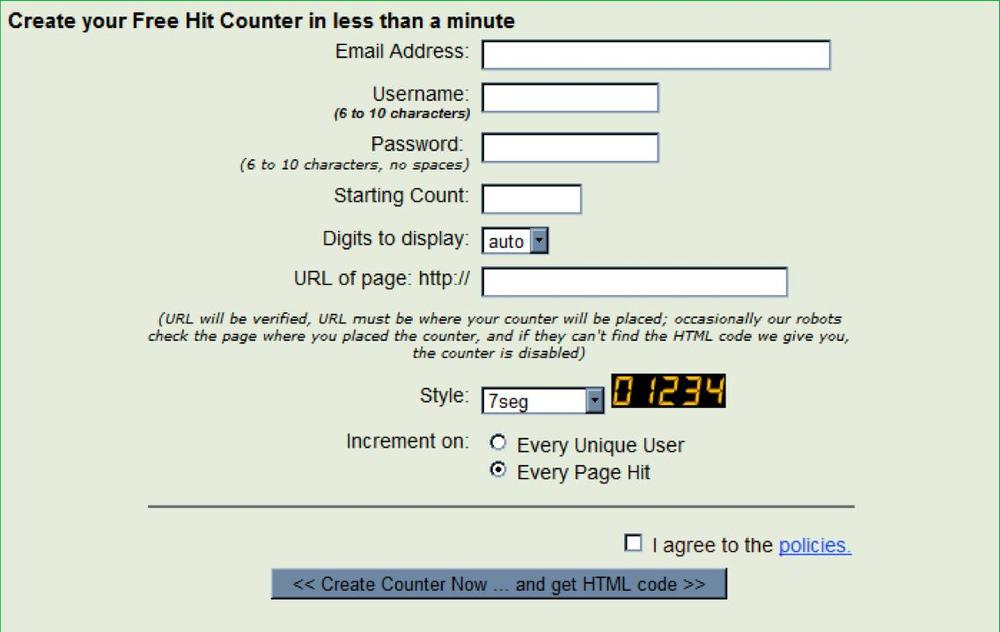
Initially, services like VisibleCounter, shown in Figure 5-44, simply embedded the number of page hits in an image that was displayed to each visitor.
Companies that created these services quickly realized that they could glean more from each request:
Several requests from the same browser are probably the same user; this allows the company to estimate the number of visitors.
Requests that include a cookie from the service are returning visitors who have been to the site before.
The identity of the page being visited can be found from the referring URL of the retrieved counter image, since that image is a component of the parent page.
As a result, static image requests became a way to get rudimentary traffic statistics.
Static image models aren’t really analytics. They only capture page traffic information, and as we’ve seen, this is misleading data that’s hard to act upon. We mention them here because this approach is unfortunately still used by certain media sites that rely on these statistics to share with advertisers to get premium rates.
Static image requests don’t carry any custom information about the visitor or the browser environment. Modern JavaScript is superior to this approach. Stat counters are used by casual website creators who aren’t interested in understanding their visitors’ behaviors or improving their sites. Now that there are free web analytics packages available, there’s no excuse to use a static image model for anything other than a lazy way of showing your audience how many visitors you’ve had.
The first three methods we looked at are all forms of server-side collection. In other words, they’re installed near the web server itself. JavaScript (and the static image model) is a client-side collection model. This is by far the dominant model on the Internet today. Browsers are able to collect and send a great deal of information about a user’s visit to a third-party system such as an analytics service. Figure 5-45 shows how this works.
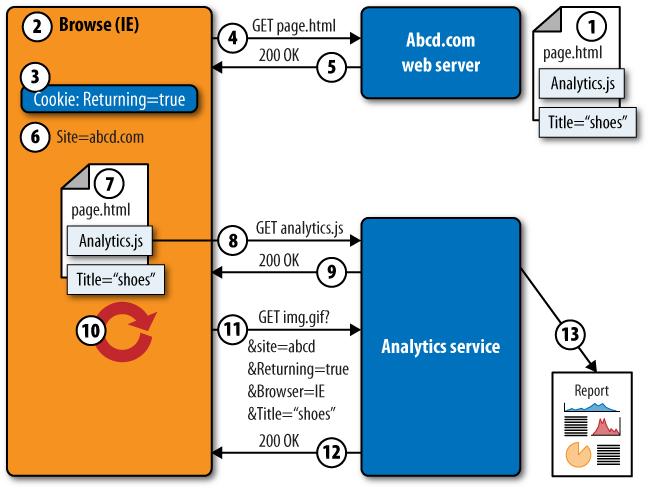
The site deploying analytics (Abcd.com) inserts a snippet of JavaScript code into its pages. The code includes a reference to a file,
Analytics.js, that’s stored on the analytics service’s servers. The site also includes tags in the page that explain what it’s about (in this case, “shoes”).A visitor launches his browser. Data about the browser is stored within the Document Object Model (DOM) of the browser.
The browser also has site-specific information, such as a cookie associated with Abcd.com. This cookie was created during a previous visit to the site.
The browser requests a page from Abcd.com.
The web server responds with a page containing the analytics script reference.
The browser’s DOM also records the fact that the site being visited is abcd.com.
As the page is loaded, the browser realizes it has to retrieve
analytics.jsfrom the analytics service.The browser requests the
analytics.jscode from the service.The analytics service responds with the analytics JavaScript. This may be cached on the browser for future use.
When the browser receives the
analytics.jsJavaScript, it executes it. The script collects data from the DOM (browser type, site name), site-specific cookies (“returning=true”) and tags within the page (“Title=shoes”).The analytics script appends all the data it has collected to a request for a tiny (1×1 pixel) image from the analytics service.
The analytics service returns the tiny image, storing the information it received about the visit.
The analytics service generates reports based on this data.
For some web platforms, such as blogs, analytics vendors provide
plug-ins to make installation even easier. Most of the time, however,
implementing JavaScript-based analytics is as easy as entering a few
lines of code in a footer.php
file or changing some file templates.
If you were installing Google Analytics, the JavaScript code would look something like this:
<script type="text/javascript">
  var gaJsHost = (("https:" == document.location.protocol) ?
  "https://ssl." : "http://www.");
  document.write(unescape("%3Cscript src='" + gaJsHost +
  "google-analytics.com/ga.js' type='text/javascript'%3E%3C/script%3E"));
</script>
  <script type="text/javascript">
  var pageTracker = _gat._getTracker("UA-xxxxxx-x");
  pageTracker._trackPageview();
</script>
Every time a browser loads a page with this script, it will make a request for http://google-analytics.com/ga.js and run the script it receives.
JavaScript is a popular collection approach, offering many advantages:
- Sees what the visitor sees
JavaScript sees what the user’s environment is like. This includes DOM information such as resolution and activity within the page, or the page’s title, or events such as Onload that mark important milestones in a page’s delivery.
- Works with SSL
Because it’s on the client, it can collect data within SSL connections.
- Augments analytics with page context
It can read tags from the page (identifying things like the products a user is browsing) and send them to the analytics platform, allowing you to more easily segment visits.
- Scales with number of users
In a JavaScript collection model, the browsers do some of the work of collecting user data. They then generate a single hit per page, rather than the hit-per-object rates of server-side collection. This reduces the load on servers somewhat.
- Opens the door to hosted services
Using JavaScript means you can send information to someone else via the visitor’s browser. Most companies’ IT organizations would be uncomfortable sending logfiles to a third party, but when the visitors’ browsers send that data, it’s acceptable.
- Keeps reporting with RIAs and “long” pages
JavaScript can manage communications with the analytics service beyond the initial page load. If a page has small subevents, such as a user clicking “play” on an embedded object, JavaScript can capture this client-side activity by sending additional information to the analytics service. JavaScript can also measure things like cursor and mouse movement and even send messages when a user closes a web page.
- Reads cookies
JavaScript can get details on the visitor from a cookie and send this to the service. So, if a user is a “platinum” subscriber to your website, you can store this in a cookie on the user’s browser. When the JavaScript executes, it can read values from the
document.cookieproperty of the page and turn them into labels for the visitor’s session that you can then use for segmentation.- Analyzes mashups
JavaScript sees requests to third-party sites. Because the JavaScript is executing as part of the container page, it sees all component objects, such as a Google Map or a YouTube video, and can report on them as well. If you’re monitoring a mashup, you need JavaScript.
When collecting through JavaScript on a client, you may face the following disadvantages:
- Can’t see out of the sandbox
JavaScript runs within a browser. Browsers “sandbox” the code they run to prevent malicious websites from gaining control of visitors’ computers. The script can’t see information such as networking statistics, because it can’t communicate directly with the operating system on which it’s running.
- Requires a loaded page
If the page doesn’t load, JavaScript is useless. This is the main reason JavaScript hasn’t had the same success for web performance monitoring that it has enjoyed for web analytics. If you want to measure problems, a system that doesn’t work when problems occur isn’t as useful.
- Requires a JavaScript interpreter
Some mobile devices, and some very paranoid visitors, may have disabled JavaScript on their browsers, limiting your ability to collect from them. Users who delete their cookies may also be misreported as new visitors when, in fact, they are returning users.
Note
According to w3schools (http://www.w3schools.com/browsers/browsers_stats.asp), about 5% of users on the Internet today block JavaScript, although this percentage has been in a steady decline since 2005. This study may be misleading, as there is no indication that it takes mobile devices into account.
- Page tagging still sucks
JavaScript’s real limitation becomes apparent due to the necessity of manually tagging a page to give it meaning. In reports, there is a big difference between seeing a page named “id=3&item=19&size=9&c=5” versus “Big Blue Shoes with Pumps.” Consequently, you will need to build analytics into your site from the outset, and it must provide context by individually tagging pages. Many sites have tens of thousands of unique pages. Tagging pages is a web analyst’s most hated chore, and a daunting task if done as an afterthought.
Despite the limitations outlined here, JavaScript offers such improved visibility into your visitors that it’s by far the leading approach to web analytics collection used online today.
You’ll probably use JavaScript for collection unless you have a site that can’t take advantage of third-party Internet-connected services. Complementing JavaScript with passive capture for measuring user experience is also increasingly common within large organizations.
Table 5-2 summarizes the trade-offs of each approach.
Table 5-2. A comparison of different methods of deploying analytics
Web logs | Server agents | Passive capture | Image request | JavaScript | |
|---|---|---|---|---|---|
Deployment | |||||
Requires physical access? | Y | ||||
Requires server administrator? | Y | Y | |||
Requires changes to page content? | Y | Y | |||
Requires Internet-connected users? | Y | Y | |||
Data stored by third party? | Y | Y | |||
Requires access to SSL keys? | Y | ||||
Requires logfile collection? | Y | Y | |||
Data visibility | |||||
Sees POST parameters? | Y | Y | Y | ||
Sees network statistics (packet loss)? | Y | Y | |||
Sees what happened when web service dies? | Y | Y | |||
Sees what happened when entire server dies? | Y | ||||
Sees failed requests (404s)? | Y | Y | Y | ||
Sees requests for non-JavaScript objects (PDFs, RSS feeds)? | Y | ||||
Sees browser information (resolution, DOM, last visit)? | Y | ||||
Sees third-party content (mashups)? | Y | ||||
Sees client-side activity (mouse movement, etc.)? | Y | ||||
Performance impact | |||||
Adds to server CPU load? | Y | Y | |||
Adds to page load time? | Y |
Now that you’ve decided how you want to collect analytics data, it’s time to decide what you don’t want to keep. Much of your web traffic isn’t from the visitors you care about: it includes malicious attackers trying to exploit known weaknesses, spammers posting content you’re going to block anyway, and crawlers busily indexing the Web. It may include synthetic tests that your web operations team is running to measure the health of the website, or it may consist of visits from internal users and employees whose traffic shouldn’t be counted.
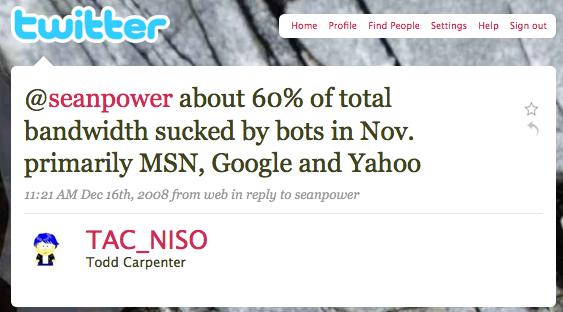
No two analytics tools will calculate the same number of hits for a website. This happens for many reasons: different filters, different definitions of a hit or a page, different JavaScript approaches, the impact of bots (which, as Figure 5-46 shows, can be significant), and different ways of inferring pages from objects.
Some of the work of filtering out the noise may be done for you, depending on your chosen approach. Most analytics packages will block visitors with known user agents (those that self-identify as crawlers). If you’re using JavaScript collection, crawlers that don’t execute JavaScript won’t send tracking hits to the analytics providers, but if you’re using server-side collection methods you’ll need to exclude this traffic.
You may not want to block synthetic traffic—it may be good to know who’s crawling your site and how often they’re updating their indexes—but you need to identify traffic that shouldn’t be included in your estimates of real visitors, or you’ll artificially lower your conversion rates.
As your site becomes better known, you’ll see an increase in the number of machine-driven visitors that generate hits. We’ve seen sites where more than half of the total web traffic isn’t actual visitors.
Now that you’re measuring how well visitors are attaining the goals you’ve set for them, it’s time to segment those visitors up into groups. This way, you can see which groups are performing poorly and help them. You can also try changes to content, promotion, and design and see whether they improve things.
All analytics tools have some amount of built-in segmentation—new versus returning visitors, referring site, browser type, country of origin, and so on. You may want to create new segments on the fly using page tags, which will allow you to group and analyze visitor performance according to new dimensions.
One quick way to do this is to use unique strings in a URL to create custom segments. For example, if you have pages whose URLs contain the strings “/buyer/” and “/seller/” in them, you can ask most analytics tools to use these to generate a custom segment such as “all URLs that contain /seller/” to see KPIs for just that part of the site.
With collection in place, goals identified, and filtering ready to clean up the noise, it’s time to tag your pages. Tagging provides context about the page that’s passed from your website to the browser, and from the browser to the analytics provider.
Tagging is where JavaScript-based collection gets complicated. To implement basic JavaScript analytics, all you had to do was include a few lines of text on each page. However, as far as the analytics service knows, those pages are identical. The only thing that makes them different is their URLs.
Consider a retail outlet that has a single page name for all products, which is a common characteristic of many retail sites. In Figure 5-47, that URL is /catalog/proddetail.asp, and it’s the same URL regardless of what product the visitor is looking at. The URL doesn’t tell us much about what’s on the page. Any human can see that the page is categorized as TV & Video→Televisions→Plasma TVs, but without some help, the JavaScript doesn’t know what the page is about.
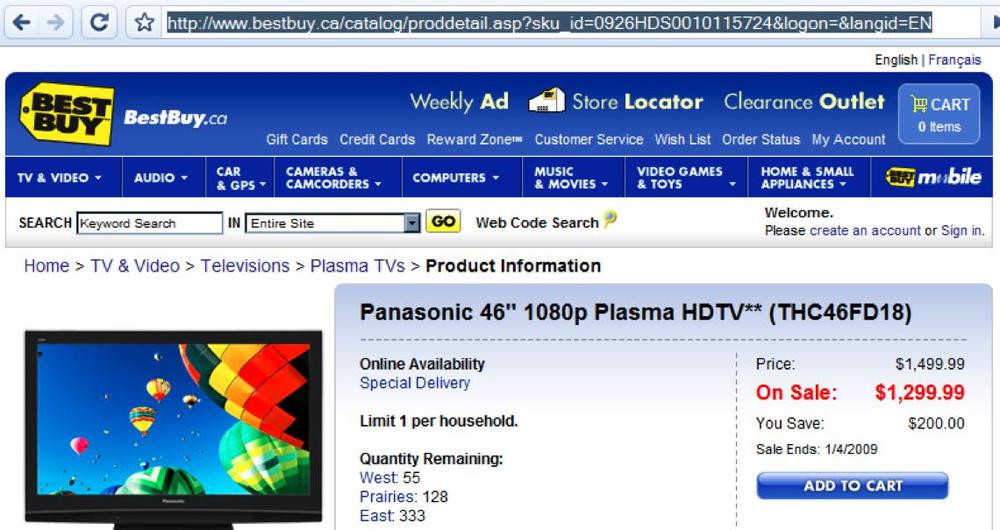
Figure 5-47. A page on BestBuy.ca showing a single URL (/catalog/proddetail.asp) for all product views
Fortunately, there’s a way to take information (such as “Televisions”) and augment the visitor’s session record with it. Let’s look at the script contained in the page in Figure 5-47 and see how it works.
First, the page includes variables that identify content, such as the user’s account, the product name and model, and the multilevel content hierarchy of the product.
<!-- BEGIN WEBSIDESTORY CODE HITBOX COMMERCE HBX1.3 (cartadd) -->
<!--COPYRIGHT 1997-2004 WEBSIDESTORY,INC. ALL RIGHTS RESERVED.
 U.S.PATENT No.6,393,479B1 & 6,766,370. INFO:http://websidestory.com/privacy-->
<script language="javascript">
var _hbEC=0,_hbE=new Array;function _hbEvent(a,b){b=_hbE[_hbEC++]
=new Object();b._N=a;b._C=0;return b;}
var hbx=_hbEvent("pv");hbx.vpc="HBX0131.01a";hbx.gn="ehg-bestbuy.hitbox.com";

//BEGIN EDITABLE SECTION
//CONFIGURATION VARIABLES
hbx.acct="DM540930IBWD";//ACCOUNT NUMBER(S)
hbx.pn="0926hds0010115724-panasonic+46+1080p+plasma+hdtv+(thc46fd18)";//PAGE NAME(S)
hbx.mlc="/online/en/tv+and+video/televisions
/plasma+tvs/details";//MULTI-LEVEL CONTENT CATEGORY
hbx.pndef="default.asp";//DEFAULT PAGE NAME
hbx.ctdef="full";//DEFAULT CONTENT CATEGORY
The page can also include custom variables (which may be used for experimentation, custom error tracking, or segmentation), as well as details such as the price or whether the visitor was told that quantities were limited. All of this data can be used later to segment buyers and see if pricing affected conversion.
//CUSTOM VARIABLES
hbx.hc1="panasonic|panasonic+46+1080p+plasma+hdtv+(thc46fd18)";//BRAND|PRODUCT
hbx.hc2="0926HDS0010115724";//SKU
hbx.hc3="";//CUSTOM 3
hbx.hc4="";//CUSTOM 4
hbx.hrf="";//CUSTOM REFERRER
hbx.pec="";//ERROR CODES

//COMMERCE VARIABLES
hbx.cacct="975410043989";
hbx.pr="panasonic+46+1080p+plasma+hdtv+(thc46fd18)";  //comma delimited products
hbx.bd="panasonic";
hbx.ca="televisions";
hbx.pc="1299.99";    //comma delimited prices
hbx.qn=""; //comma delimited quantities
hbx.sr="1";    //store
hbx.cp="null";  //campaign
hbx.cam="0";  //cart add methodology, 0 = highwatermark, 1 = incremental
hbx.pv=1;  //product view flag, 0 = cart add, 1 = product view

//END EDITABLE SECTION
Note that these variables are seldom handcoded into the page. Rather, the application inserts them dynamically each time it renders the page. In other words, implementing tagging means working with developers.
Now the analytics script assembles all of these tags and details,
along with browser information such as the type of web browser (navigator.appversion), the title of the page
(document.title), and the referring
URL (document.referrer):
function $ii( a, b,c){ return a.indexOf(b, c?c:0)};
function $is(a,b, c){return b>a.length?
"":a.substring(b,c!=null?c:a.length)};function $a(v){ return
 escape(v) }; var _sv=10, _bn=navigator.
appName,_mn="we74",_bv=parseInt(navigator.appVersion),_rf=$a(document.referrer),
_epg="n&cam="+hbx.cam+"&pv="+(hbx.pv?"1":"0&abd_type
=cart_add")+"&product="+$a(hbx.pr)+
"&quantity="+$a(hbx.qn)+"&brand="+$a(hbx.bd)+"&category="+$a(hbx.ca)+"&
price="+$a(hbx.pc)+
"&store="+$a((hbx.sr=="S"+"TORE")?1:hbx.sr)+"&tz=
PST&aid="+hbx.cacct;if(!$ii(_bn,"Micro"+
"soft"))_bn="MSIE";if(_bn=="MSIE"&&_bv==2)_bv=3;function $l(m,l){return m=="/"?
m:(($ii(m,"/")?"/":"")+(m.lastIndexOf("/")==l?m.substring(0,l):m))};function $n(
a,b){return(a==""||a=="/")?"/":$is(a,hbx.ctdef!="full"?a.lastIndexOf("/",b-2): $ii(
a,"/"),b)};function $o(a,b,c){var d=location.pathname,e=$is(d,d.lastIndexOf("/")+
1,d.length);if(a&&b==c){return(hbx.pndef=="title"&&document.title!=""&&document.
title!=location)?document.title:e?e:hbx.pndef}else{return(b==c)?$n(d,d.lastIndexOf(
"/")):$l(b,b.length-1)}};function $p(a,b,c,d){return ""+(c>-1?$o(b,$is(a,0,c),d
)+";"+$p($is(a,c+1),b,$ii($is(a,c+1),";")):$o(b,a,d))};
hbx.mlc=$p( hbx.mlc,0,$ii(hbx.mlc,
";"),"CONTENT+CAT"+"EGORY");hbx.pn=$p(hbx.pn,1,$ii
(hbx.pn,";"),"PUT+"+"PAGE+NAME+HERE" );
</script><script type="text/javascript" src="/javaScript/hitbox/hbx.js"></script>
<noscript>
The result of all this work is a reference to an image embedded in the page. The browser requests the image from the analytics service (in this case, ehg-bestbuy.hitbox.com).
<img src="http://ehg-bestbuy.hitbox.com?hc=none&
cd=1&hv=6&ce=u&hb=DM540930IBWD&aid=975410043989&n=0926hds0010115724-panasonic
+46+1080p+plasma+hdtv+(thc46fd18)&vcon=/online/en/tv+and+video/
televisions/plasma+tvs/details&seg=&cmp=&gp=&cam=0&pv=1
&abd_type=cart_add&product=panasonic+46+1080p+plasma+hdtv+(thc46fd18)&quantity
=&price=1299.99&store=1&tz=PST&vpc=HBX0131.01an"
 border="0" width="1" height="1"></noscript>
<!-- END WEBSIDESTORY CODE  -->
All of the metadata about the page is appended to the request in the form of a set of URI parameters. The publisher of the page never intends to display this image (it’s 1 × 1 pixel wide with no border). The image doesn’t matter, though: it’s the request that matters.
If you have a small site that doesn’t have dynamic backends, however, you may have to manually edit page content to provide context about the page to whatever analytics package you’re using. Some packages, like Google Analytics, make this fairly simple, while enterprise-grade packages are much more demanding, but provide better segmentation and analytics as a result.
The tagging process varies by analytics platform. There are a few great analytics integration checklists on the Web. For Google Analytics, check out:
For larger platforms, like Omniture, check out:
One final note on JavaScript implementation: page tags can bloat pages and cause them to load slowly, so it makes sense to put this kind of content at the bottom of your pages.
By defining your goals, you’re able to determine where visitors went, and by tagging your pages, you’re able to provide context for what they did. There’s one more piece missing, however: you need to capture the things that drove people to your site in the first place.
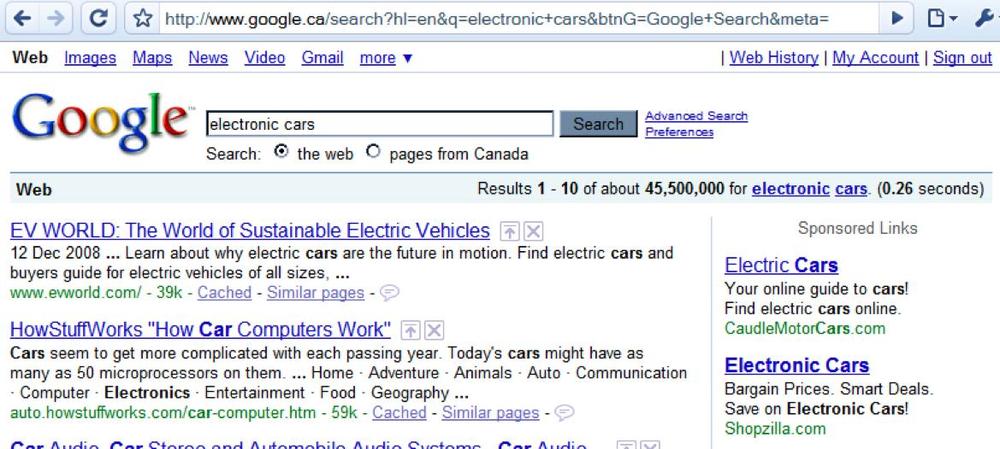
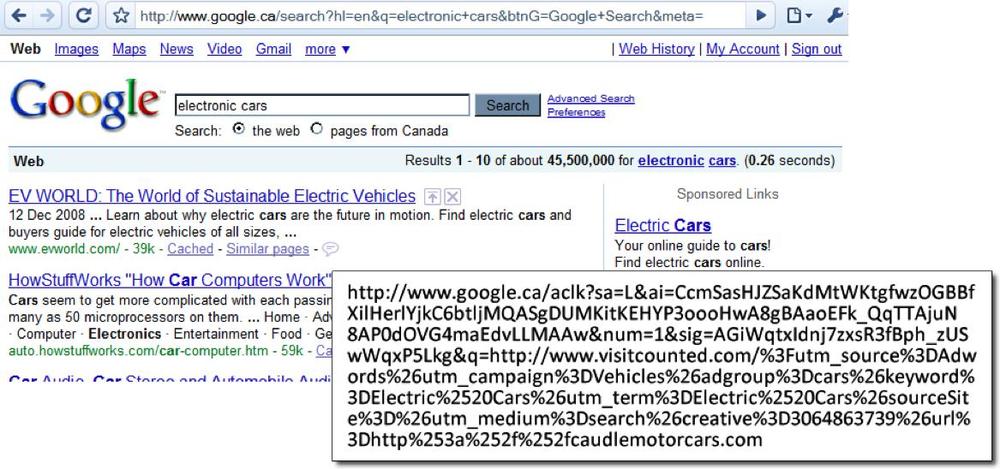
When a user searches for something, the referring URL contains a list of search terms. A search for “electronic cars,” for example, has the URI parameters q=electronic+cars, as shown in Figure 5-48. When an analytics script sends the referring URI to an analytics service, the service can parse this URI and see that the keywords “electronic” and “cars” were used.
If the link is part of a paid campaign, however, the link doesn’t
go directly to the destination site. Instead, it first requests an ad
click object from the search engine (in this case,
www.google.ca/aclk) with a number of parameters
identifying the campaign, the advertiser, and so on, as shown in Figure 5-49.
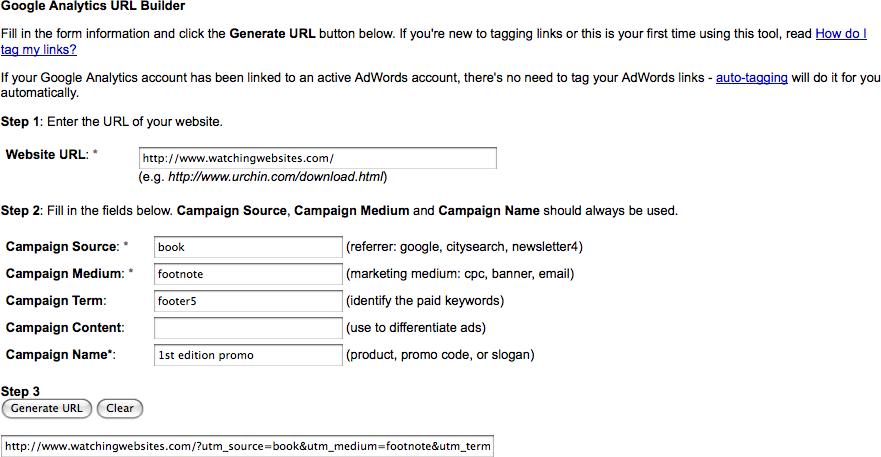
Your analytics tool needs to extract the campaign information from the subsequent referring URI, which you can then use to segment visitors according to campaigns and goal attainment. Google Analytics does this automatically for Google AdWords, but you can manually create a URL using Google’s URL Builder (www.google.com/support/googleanalytics/bin/answer.py?hl=en&answer=55578), shown in Figure 5-50.
Campaign information can also be embedded in pages. In the Best Buy example cited earlier, the site operator can embed form, segment, and campaign information within the page according to landing page or elements of the referring URL. Some of these attributes may be passed from page to page during a visit.
//OPTIONAL PAGE VARIABLES
//ACTION SETTINGS
hbx.fv="";//FORM VALIDATION MINIMUM ELEMENTS OR SUBMIT FUNCTION NAME
hbx.lt="auto";//LINK TRACKING
hbx.dlf="n";//DOWNLOAD FILTER
hbx.dft="n";//DOWNLOAD FILE NAMING
hbx.elf="n";//EXIT LINK FILTER

//SEGMENTS AND FUNNELS
hbx.seg="";//VISITOR SEGMENTATION
hbx.fnl="";//FUNNELS

//CAMPAIGNS
hbx.cmp="";//CAMPAIGN ID
hbx.cmpn="";//CAMPAIGN ID IN QUERY
hbx.dcmp="";//DYNAMIC CAMPAIGN ID
hbx.dcmpn="";//DYNAMIC CAMPAIGN ID IN QUERY
hbx.hra="ATT";//RESPONSE ATTRIBUTE
hbx.hqsr="";//RESPONSE ATTRIBUTE IN REFERRAL QUERY
hbx.hqsp="";//RESPONSE ATTRIBUTE IN QUERY
hbx.hlt="";//LEAD TRACKING
hbx.hla="";//LEAD ATTRIBUTE
hbx.gp="";//CAMPAIGN GOAL
hbx.gpn="";//CAMPAIGN GOAL IN QUERY
hbx.hcn="";//CONVERSION ATTRIBUTE
hbx.hcv="";//CONVERSION VALUE
With collection, filtering, goals, tagging, and campaign segmentation in place, it’s time to start testing. Here’s a quick preflight checklist.
Compare pages with JavaScript to those without, and ensure that the time it takes to load the page hasn’t increased too much. If it has, you’ll negatively affect conversion. For more information on how to measure page performance, see Chapters 8 through 10
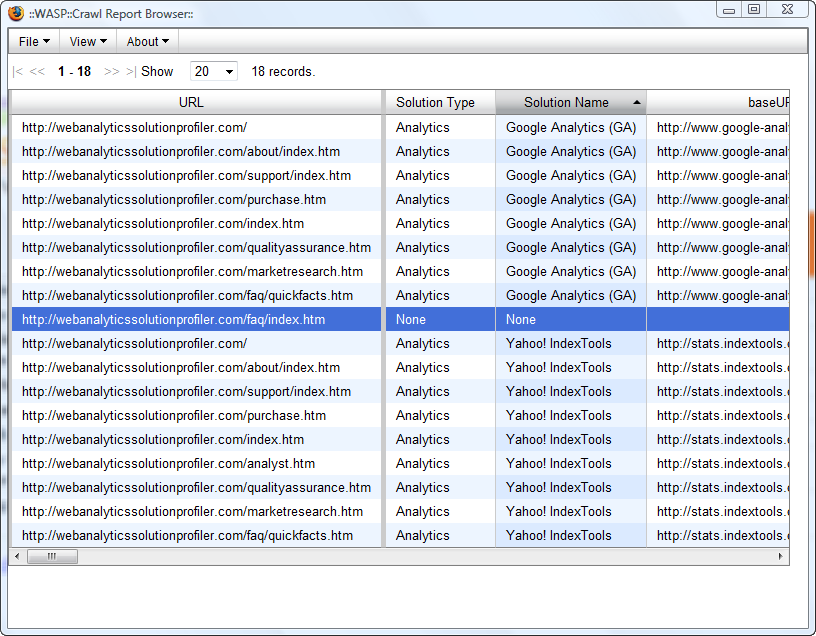
Go to each section of the site and view the page source to ensure the scripts appear in the correct places. It can be hard to do this manually, but you can use tools like Stephane Hamel’s WASP (http://webanalyticssolutionprofiler.com/), shown in Figure 5-51, to crawl a site and identify improperly instrumented pages, or a tool like Firebug to see what’s running when you load a site.
A common problem when implementing analytics is getting goals wrong. If analytics isn’t measuring the right steps in a goal, you can’t measure success. Fortunately, there are a variety of ways to check goal outcomes and see if you’re tracking them properly.
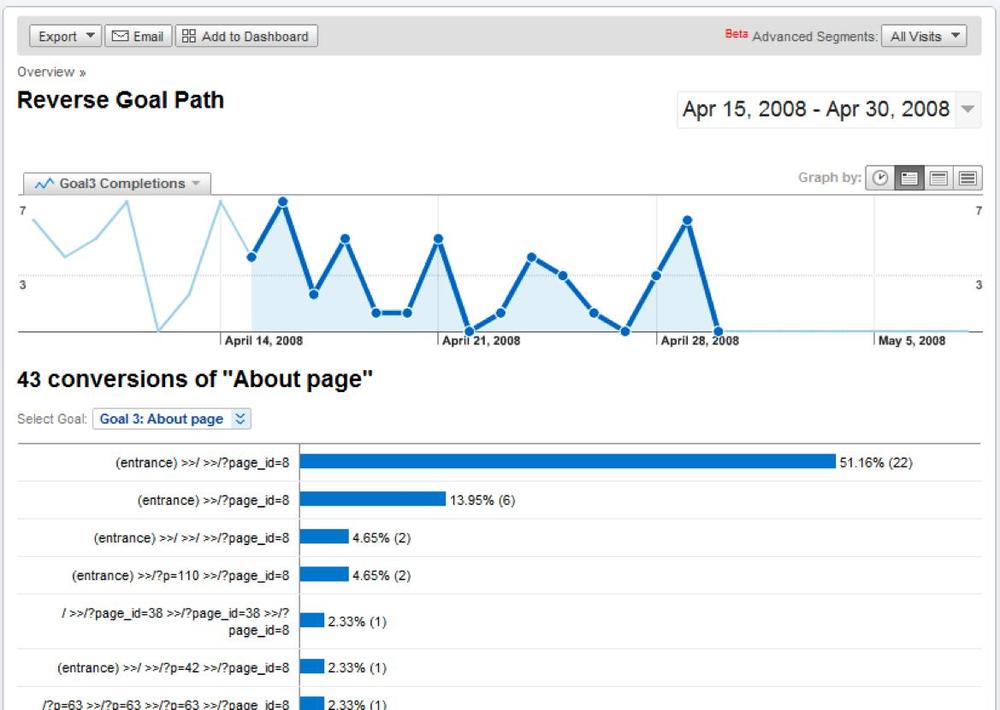
A reverse goal path, like the one shown in Figure 5-52, shows how visitors reached a goal and may identify other paths toward an outcome that you didn’t know about. This is a good way to catch missing steps in a conversion process.
You should also compare your financials to your analytics: if the accounting department says you received 20 orders on Monday, but your system only saw 5, something is definitely amiss.
The easiest way to check page tags is to run reports and see if pages are properly identified. If you want to examine your configuration more closely, change your browser’s user agent to something unique, making it easier to identify within your analytics package.
Here’s a good way to use Firefox to determine if your tags are working correctly:
Open a new browser window.
Enter
about:configin the browser’s address bar.Right-click the blank area on the screen and select New from the drop-down list.
Select String to create a new browser property as a string.
Enter
general.useragent.overridefor the preference name.Enter a user agent string of your choosing for the value.
To check that it’s properly configured, type
useragentin the Filter field. You should see a screen similar to the one shown in Figure 5-53.
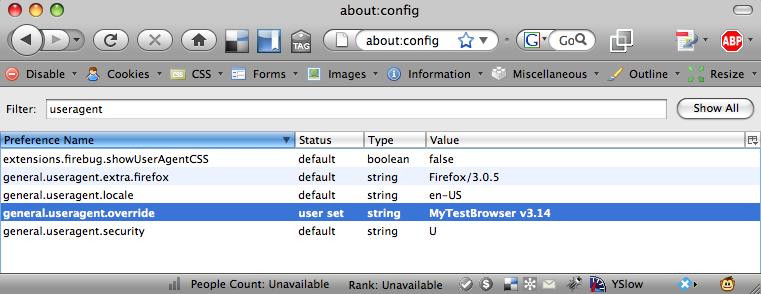
Now when you surf with this browser, you’ll be identified with the new string instead of your standard browser. You can try out the site, then run an analytics report for this user agent or look for it in logfiles to see the results.
Unfortunately, most analytics tools generate reports only once a day, which means that testing configurations can be time-consuming and iterative, with day-long waits before you can see if your latest changes are working. Some analytics packages, such as Clicky, report data more frequently, making them easier to configure and test.