
Different synthetic tests probe different layers of the Internet infrastructure we reviewed earlier. Each kind of test provides information on the health of a component or a service, and all are useful for determining where issues lie.
As you’ve seen, DNS is an important source of latency for mashups and a common culprit when sites aren’t accessible. DNS services are also a common point of attack for hackers, who try to “poison” domain name listings, which can misdirect visitors to other locations. In other words, you need to watch:
The response time for DNS lookups
DNS resolution of every site involved in building a page, not just your own
Whether the DNS lookup returns the correct IP addresses
If you’re using a CDN to speed up the delivery of your web pages to the far reaches of the Internet, the CDN may be operating your DNS on your behalf. This isn’t an excuse not to test DNS resolution; in fact, you may want to watch more closely to be sure that IP addresses don’t change without your approval. However, CDNs use resilient DNS services and Global Server Load Balancing (GSLB), which significantly improve the performance and availability of DNS resolution.
In most cases, you won’t test DNS by itself. It will be a part of a synthetic test, and will be shown as the first element of latency in a test’s results. Verifying that the content of a page is what you expect it to be will also let you know if your page has been hacked or if users are being redirected elsewhere because of a poisoned DNS.
In the previous chapter, we looked at traceroute as a tool for measuring the round-trip time between a client and a server. Traceroutes let you peer into the inner workings of the Internet. But because of the way traceroute collects information—sending several packets to every intervening device—it places a lot of load on the Internet’s routers. As the traceroute manpage explains:
This  program  is intended for use in network testing,
measurement and management.  It should be used primarily for manual fault
isolation.  Because of the load it could impose on the network, it is un
wise to use traceroute during normal operations or from automated scripts.
Don’t run traceroutes via automated scripts. Instead, use them as a diagnostic tool to tell where something has gone wrong across the Internet devices between a client and a website.
Recall that it’s possible to use TCP, UDP, or ICMP traceroutes; you should use TCP traceroutes because they’ll be treated in the same way that HTTP or HTTPS traffic would, while many parts of the Internet treat ICMP traffic differently. Also, don’t expect traceroutes to always look clean; some devices won’t return information about themselves, or will block downstream devices entirely.
Several synthetic testing services will perform automated traceroutes when they detect an outage, and include this information with the alert they send.
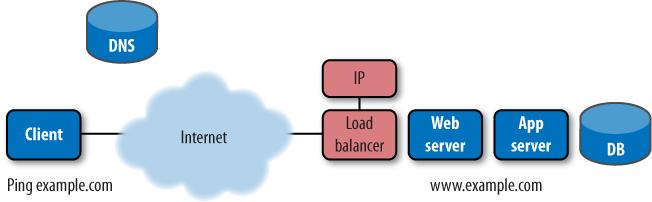
Once you’ve confirmed that DNS can resolve the IP address of a site, and that the route across the Internet is clear, the most basic test you can run is to send a single packet to a website and receive a response. This is known as a ping, or ICMP ECHO. The device that receives the ping responds in kind (Figure 9-6). In most web applications, the responding device is a firewall or load balancer.
A transcript of a ping looks like this:
macbook:~ sean$ ping failblog.org
PING failblog.org (72.233.69.8): 56 data bytes
64 bytes from 72.233.69.8: icmp_seq=0 ttl=50 time=57.457 ms
64 bytes from 72.233.69.8: icmp_seq=1 ttl=50 time=58.432 ms
64 bytes from 72.233.69.8: icmp_seq=2 ttl=50 time=56.762 ms
64 bytes from 72.233.69.8: icmp_seq=3 ttl=50 time=56.780 ms
64 bytes from 72.233.69.8: icmp_seq=4 ttl=50 time=58.273 ms
64 bytes from 72.233.69.8: icmp_seq=5 ttl=50 time=58.555 ms
^C
--- failblog.org ping statistics ---
6 packets transmitted, 6 packets received, 0% packet loss
round-trip min/avg/max/stddev = 56.762/57.710/58.555/0.751 ms
The ping contains the number of bytes received, the address of the host, and a sequence number, which can be used to identify any lost packets. The hop count is in the direction of the response (one-way) while the time measurement is the round-trip time (back and forth).
On a less reliable network, ping helps us to understand the quality of the connection. Here’s a ping run from a wireless network on a train:
macbook:~ sean$ ping vangogh.cs.berkeley.edu
PING vangogh.cs.berkeley.edu (128.32.112.208): 56 data bytes
64 bytes from 128.32.112.208: icmp_seq=0 ttl=41 time=296.634 ms
64 bytes from 128.32.112.208: icmp_seq=1 ttl=41 time=431.799 ms
64 bytes from 128.32.112.208: icmp_seq=2 ttl=41 time=352.870 ms
64 bytes from 128.32.112.208: icmp_seq=3 ttl=41 time=479.129 ms
64 bytes from 128.32.112.208: icmp_seq=4 ttl=41 time=503.164 ms
64 bytes from 128.32.112.208: icmp_seq=5 ttl=41 time=291.246 ms
64 bytes from 128.32.112.208: icmp_seq=7 ttl=41 time=777.717 ms
64 bytes from 128.32.112.208: icmp_seq=8 ttl=41 time=391.574 ms
64 bytes from 128.32.112.208: icmp_seq=9 ttl=41 time=722.543 ms
64 bytes from 128.32.112.208: icmp_seq=10 ttl=41 time=1770.265 ms
64 bytes from 128.32.112.208: icmp_seq=12 ttl=41 time=588.587 ms
64 bytes from 128.32.112.208: icmp_seq=13 ttl=41 time=1114.075 ms
64 bytes from 128.32.112.208: icmp_seq=15 ttl=41 time=2086.454 ms
64 bytes from 128.32.112.208: icmp_seq=16 ttl=41 time=1809.736 ms
^C
--- vangogh.cs.berkeley.edu ping statistics ---
19 packets transmitted, 14 packets received, 26% packet loss
round-trip min/avg/max/stddev = 291.246/829.699/2086.454/595.160 ms
A ping test ends with a summary of the results. In this example, over a quarter of all packets that were sent were lost entirely, and the average packet took 829.699 milliseconds. This kind of latency and packet loss effectively renders the Internet unusable.
Ping is a general-purpose tool used for testing reachability, packet loss, and latency for any kind of application, including voice, video, file transfers, and so on. It’s the most basic test of Internet reachability. Ping tests have some important limitations, however.
The Internet may treat pings differently from web traffic:
In some cases, firewalls and load balancers simply won’t respond to pings, or will block them entirely.
Some networks may prioritize pings differently, so the results you get won’t be representative of HTTP traffic.
Because a ping only tests whether the server’s Internet connection is working, and does not check the actual web service, it won’t detect web problems such as missing content, a locked database, or an Apache service that isn’t responding correctly.
Nevertheless, ping tests are easy to run and are the backbone of up/down monitoring on the Internet. Some synthetic testing portals offer hosted services that ping an IP address at regular intervals. This may be your only monitoring strategy for nonweb devices that you need to monitor.
Knowing that your web server is reachable doesn’t mean users are getting the right content. Your DNS, network, and Internet-facing devices may be fine, but your website can still be down. The only way to tell whether the web service is working properly is to ask it for something and see what happens.
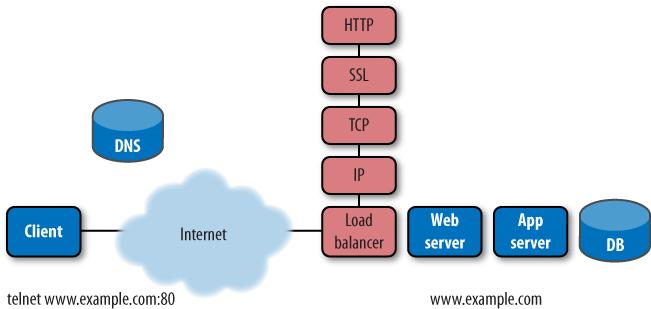
The simplest synthetic web test asks a server for content (using the HTTP GET method), times the response, and checks for an HTTP 200 status code confirming that the request was handled. In doing so, it tests not only the server’s network layer (IP), but also the TCP layer (which manages end-to-end sessions) and any encryption (if present), as shown in Figure 9-7.
The HTTP GET is the workhorse of synthetic monitoring. It retrieves a single object, and in doing so verifies that many systems are functioning correctly. By timing the various milestones in the request and response, a testing service can blame poor performance on the correct culprit, whether it’s DNS, network latency, or a slow server. Similarly, it can determine whether an error is caused by a bad network, a broken server, or missing content.
Having sent a request and received an HTTP 200 OK in return, you might be tempted to pronounce the test a success. After all, you asked for content and received it. Some synthetic testing scripts stop here—particularly the free ones.
However, if you look deeper into the resulting response you’ll see that there’s a problem:
<div id="bd"><h1>Sorry, the page you requested was not found.</h1>
<p>Please check the URL for proper spelling and capitalization. If
 you're having trouble locating a destination on Yahoo!, try visiting the
 <strong><a href="http://us.rd.yahoo.com/default/*http://www.yahoo.com">Yahoo!
 home page</a></strong> or look through a list of
 <strong><a href="http://us.rd.yahoo.com/default/*http://docs.
yahoo.com/docs/family/more/">Yahoo!'s online services</a>
</strong>. Also, you may find what you're looking for if you try searching below.</p>
Figure 9-8. An apology page response for missing content that was served with an HTTP 200 OK status code
Despite the HTTP 200 OK response, the page you asked for didn’t exist. Instead, you received a polite apology shown in Figure 9-8. In the early days of the Web, the ubiquitous “HTTP 404 Not Found” made it clear that you had asked for something nonexistent. Today, however, apology pages are commonplace, and they can hide errors.
Dynamic content further complicates the detection of
errors. When you return to a portal, it probably welcomes you back by
name. Your version of that page is different from someone else’s
version. Similarly, for a media site, news changes constantly. Even when
part of the site is broken, much of the page will still render properly,
and only one frame or section will indicate a problem (as shown in Figure 9-9). In other words,
you’ll never retrieve exactly the same page twice. So how does a
synthetic test know that it’s retrieved a valid copy of index.html when every copy is
different?

To properly understand the performance and availability of a web application, you need to monitor dynamic content despite the fact that it’s changing, as shown in Figure 9-10.
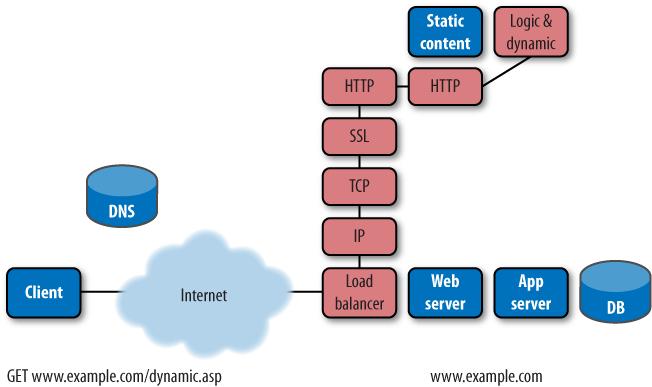
Figure 9-10. Checking for more than just an HTTP status code ensures you measure whether dynamic applications are working
The right way to check for HTTP content is to do the following:
Check that the site returns an HTTP status code you want (generally a 200 OK).
Check for content that should be there. Not all of a dynamic page changes every time. Often, changes are limited to a particular
DIVtag, or certain cells of the table. The synthetic test needs to look for specific strings that are always present to confirm that the page is working. In Figure 9-10, this might be the text “Customize your reddit.” You need to configure known keywords for each page you want to test and then make sure the application team doesn’t remove them, which would lead to false alarms.Check for content that shouldn’t be there. In Figure 9-10, this would involve making sure you don’t see the string “There doesn’t seem to be anything here.” This is easiest to implement—you just need to be sure you’re not getting a specific set of text—but it’s error-prone because it won’t detect errors that fail to give you the string you’re looking for (as in cases of site vandalism.)
While an HTTP GET for a static page will verify that the network, load balancer, and HTTP service are functioning correctly, it won’t include the processing delay that comes from building dynamic pages. To properly measure performance, it’s important to simulate what visitors see, even the parts that make the server work. You therefore need to test dynamic pages to measure real site performance.
The time it takes the server to send back the first byte of a response (known as time-to-first-byte in many testing reports) is roughly equivalent to the time the server takes to prepare the response, plus one network round trip. Because of this, if you have measurements of static and dynamic pages side by side, you can measure the difference and determine just how long the server is taking to process dynamic content.
Simply checking a dynamic page may not reveal the delay that backend data services are causing. To test the performance and availability of backend systems, you need to request content that forces the application to communicate with the database, as shown in Figure 9-11.

One way to isolate the database tier so you can test it is to have your developers build a page that exercises the backend of the application, writing data to a record and retrieving it before displaying a message indicating success. This might be a specific URL that, when requested, responds with considerable detail about the health of backend systems.
Here’s an example of this kind of page:
macbook:~ alistair$ telnet www.bitcurrent.com 80
Trying 67.205.65.12...
Connected to bitcurrent.com.
Escape character is '^]'.
GET backendtest.cgi
<HTML><HEAD></HEAD>
<BODY>
Authentication check: <B>Passed</B> - 60ms
Database read: <B>Passed</B> - 4ms
Database write: <B>Passed</B> - 12ms
Partner feed: <B>NO RESPONSE</B> - N/A
</BODY>
<HTML
This is a trivially small response from a server, but it includes tests for authentication, database read and write, and access to a third-party server. You can set up monitoring services to look for the specific confirmation messages and to alert when an error (such as NO RESPONSE) occurs. If your monitoring service captures the page when an error occurs, you’ll also have data from the responses at hand.
You can measure the performance of the database tier by comparing the performance of this page to that of a dynamic page that doesn’t involve database access, which will help you to anticipate the need for more database capacity. In fact, this approach of creating a custom page that checks a particular backend element, then configuring a synthetic test, can be applied to any service on which your application depends, such as credit card transaction processing, currency conversion, hosted search, and so on. Just be sure to secure the test pages with proper authentication so that the backend service doesn’t become a point of attack for hackers.