At its simplest, VOC is just a fancy term for surveys that solicit feedback about your site or your organization. The invitation may come from a pop-up message when visitors first arrive at your site, or from a feedback button on a page. It may even come from an email message that you send to customers.
The surveys use a variety of questions and formats to gauge how respondents feel about things. They also collect data on the respondents so that analysts can correlate the responses to specific groups.
There are four main reasons for companies to conduct VOC studies.
- To get new ideas
Your customers may have motivations or concerns you’re not aware of, and asking them can yield new ideas. Once you have an idea, you need to then find out whether it is valid and applies to a broader audience, or is limited to just a few respondents.
- To evaluate things you can’t find out elsewhere
This can be particularly helpful in evaluating your competitive environment. For example, if you’re running a media site, you may want to identify direct competitors (other media sites, for example) and indirect competitors (television or movie theatres) your visitors are aware of.
- To see whether improvements worked
This may be a simple evaluation—asking for a user’s impression of a new feature—or it may involve comparing satisfaction scores before and after an upgrade to see whether users prefer the new approach.
- To collect demographic data (such as age and income) that you can’t get elsewhere
This information provides new dimensions along which to segment visitors and learn for whom your site is working best or worst. If you’re running a media site, you’ll also need independently verified demographic data to attract advertisers.
Let’s look at some of the things that VOC studies deliver.
First and foremost, VOC gives you clues. It’s impossible to get inside your customers’ heads and understand their motivations. Many of their motivations are unconscious, so they couldn’t tell you why they did something even if you asked them directly.
Mohan Sawhney (www.smeal.psu.edu/isbm/documents/0206msum.pdf) of the Kellogg School of Management says:
Customer insights do not come from quantitative market research. You cannot generate insight out of numbers. Numbers help you to validate insights. A customer insight is a fresh and not-yet obvious understanding of customer beliefs, values, habits, desires, motives, emotions or needs that can become the basis for a competitive advantage. You have to go deeper than what customers themselves say. Insights are not immediately apparent. Anomalies are an excellent starting point for generating insights.
However, you can ask open-ended questions like the ones in Figure 7-4 and review the feedback for clues. It’s often open-ended responses like these that yield the most insight.

Note
Throughout this chapter, we’re going to use examples from several online surveys we’ve seen over the last year, administered by multiple VOC services. We don’t mean to pick on them—or endorse them—but we should thank them. They’re trying to learn more about their visitors, and even when they do so clumsily, they’re still well ahead of the majority of sites on the Web.
Sifting through hundreds of responses isn’t always easy. Fortunately, there are tools and visualizations, such as tag clouds or concordances, that can tease common themes from this kind of unstructured data. By correlating such visualizations with scorecard responses, you can make statements such as, “People who scored their visits badly mentioned these keywords most often in their feedback.”
VOC is excellent for collecting subjective information. Suppose you’re trying to accomplish the goal of fostering a sense of community. A question like the one in Figure 7-5 can tell you whether you’re achieving that goal in the minds of your visitors.

Figure 7-5. Using a range of subjective rankings (known as a Likert scale) is a good way to capture visitor impressions
Unfortunately, many companies first make changes to their sites, then survey to see if the changes worked. This doesn’t provide the comparative before/after data that you need to determine whether your change actually had an impact. It’s better to launch a VOC survey before a change to develop a baseline against which future adjustments are made.
Every website has a target audience in mind. When you launched the site, you intended it to be used by a certain class of visitor. Any marketing message works best when it’s tailored to a specific audience. If your actual visitors aren’t who you think they are, you may need to adjust your messages, or even your business, accordingly.
Finding out whether your intended visitors match your actual visitors can be hard to do with technology, so sometimes you just have to ask them.
If you want to segment your user population, it’s a good idea to ask for demographic data, like gender and age (Figure 7-6). Ensure you are not violating any legislation on the storage of personally identifiable information, however. Some regions require that you let respondents opt out of specific questions (www.casro.org/codeofstandards.cfm).

We call environmental data that relates or affects someone’s online activity surfographics. In other words, anything that describes a user’s environment while they surf—like accessibility tools, or multiple computers per household—are surfographics characteristics. It’s extremely important to track, and is often overlooked. It includes use and behavioral data that can affect the accuracy and usefulness of your other web monitoring data.

If you’re running a media site, one of your most important metrics is audience size—how many people visit your website. Most organizations count this by measuring the number of unique cookies that request data from the site on a given day, but those numbers are wrong. And it’s not just deleted cookies that skew unique visitor count—one person with several computers, or one computer with several users, can interfere with a proper assessment of readership.
If you use a survey like the one in Figure 7-7 to collect data on how many computers visitors have or how many people share a computer, you can adjust your readership numbers accordingly.
Some visitors are extremely comfortable with the Web, while others only discovered email last week. You’ll get dramatically different results to questions like those in Figure 7-8 depending on the respondent’s experience with the Internet, and it’s important to tie this data to the rest of their responses.
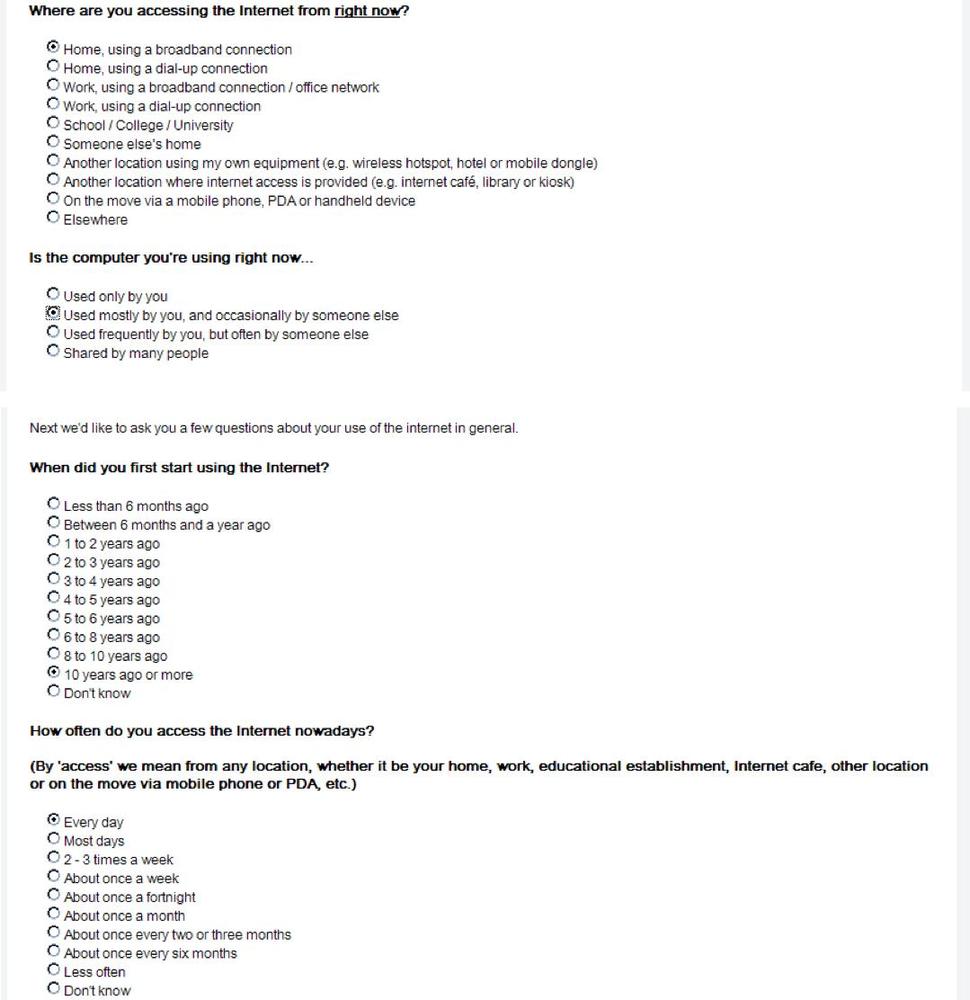
This is also important information for web designers and usability testers, as something that seems obvious to one segment of your audience may be opaque to another.
Your web analytics tools should show you where your visitors came from. Some traffic sources can’t be tracked, however, and in these cases it’s acceptable to ask visitors how they found you, as shown in Figure 7-9.

Figure 7-9. One important use of VOC is to determine the source of a visit, particularly ones in which referring URLs aren’t available
For example, a visit that began with a desktop email client or a desktop microblogging client will lack a referring URL—both appear to have been typed into a browser. And yet one started with an email message from a friend, while the other stemmed from a community discussion on Twitter.
You should still compare this data to analytics information—if a visit came from a search engine, but the visitor claims it was from a social network, you’ve learned that this particular visitor doesn’t pay a lot of attention to how he finds out about destinations on the Web (or tends to lie!), and you can view the rest of his results with that in mind.
Jonathan Levitt of VOC provider iPerceptions notes that his firm sees “two distinct measurements of visit mechanics: the path to the site (i.e., ‘direct referrer’) and the medium that most influenced the desire to visit (i.e., ‘print media,’ ‘broadcast”, and so on).” In other words, where someone came from and what motivated him to visit may not be the same thing.
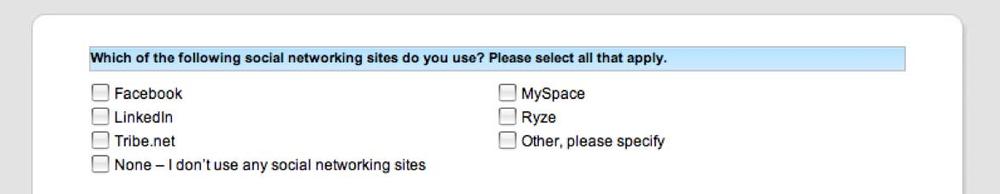
It’s also a good idea to find out where your visitors hang out, so you can be sure to include those destinations in your community monitoring strategy with a question like the one in Figure 7-10. With the rapid growth of social networks, it’s important to keep your list of sites current so users can quickly indicate the ones they visit.