
- Complete Web Monitoring
- Transactional Sites
- Collaboration Sites
- Software-as-a-Service Applications
- 3. What Could We Watch?
- How Much Did Visitors Benefit My Business?
- Where Is My Traffic Coming From?
- What’s Working Best (and Worst)?
- How Good Is My Relationship with My Visitors?
- How Healthy Is My Infrastructure?
- How Am I Doing Against the Competition?
- Where Are My Risks?
- What Are People Saying About Me?
- How Are My Site and Content Being Used Elsewhere?
- The Tools at Our Disposal
- 4. The Four Big Questions
- II. Web Analytics, Usability, and the Voice of the Customer
- 5. What Did They Do?: Web Analytics
- Dealing with Popularity and Distance
- The Core of Web Visibility
- A Quick History of Analytics
- The Three Stages of Analytics
- Implementing Web Analytics
- Sharing Analytics Data
- Choosing an Analytics Platform
- The Up-Front Work
- Web Analytics Maturity Model
- 6. How Did They Do It?: Monitoring Web Usability
- Web Design Is a Hypothesis
- Seeing the Content: Scrolling Behavior
- Proper Interactions: Click Heatmaps
- Data Input and Abandonment: Form Analysis
- Individual Visits: Replay
- Stalking Efficiently: What You Replay Depends on the Problem You’re Solving
- Post-launch usability testing: Are my designs working?
- Conversion optimization: why aren’t conversions as good as they should be?
- Helpdesk support: Why is this visitor having issues?
- Incident diagnosis: Why is this problem happening?
- Test case creation: What steps are needed to test the app?
- Dispute resolution: How do I prove it’s not my fault?
- Retroactive Segmentation: Answering “What If?”
- Stalking Efficiently: What You Replay Depends on the Problem You’re Solving
- Implementing WIA
- 5. What Did They Do?: Web Analytics
- Web Interaction Analytics Maturity Model
- 7. Why Did They Do It?: Voice of the Customer
- The Travel Industry’s Dilemma
- They Aren’t Doing What You Think They Are
- What VOC Is
- What VOC Isn’t
- Four Ways to Understand Users
- Kicking Off a VOC Program
- Planning the Study
- The Kinds of Questions to Ask
- Designing the Study’s Navigation
- Why Surveys Fail
- Don’t ask for frequency of visits
- Don’t ask about subscription rates
- Don’t ask what they just did
- Don’t use VOC to determine web performance
- Don’t ask about loyalty
- Don’t ask for demographic data that you can get from other sources
- Don’t ask questions they can’t answer
- Don’t ask too many questions
- Don’t ask a question that won’t reveal anything
- Always give visitors an out
- Discourage lingering
- Provide room for subjective feedback when no answer applies
- Integrating VOC into Your Website
- Trying the Study
- Choosing Respondents
- Deciding Who to Ask
- Encouraging Participation
- Advantages, Concerns, and Caveats
- III. Web Performance and End User Experience
- 8. Could They Do It?: End User Experience Management
- What’s User Experience? What’s Not?
- The Anatomy of a Web Session
- Wrinkles: Why It’s Not Always That Easy
- DNS Latency
- Multiple Possible Sources
- Slow Networks
- Fiddling with Things: The Load Balancer
- Server Issues
- Server OS: Handling networking functions
- Web service: Presentation layer, file retrieval
- Dynamic tier: Application logic
- Storage tier: Data, state persistence
- Third-party components: Web services, transaction processing
- Permissions and authentication
- The relationship between workload and performance
- The end result: Wide ranges of server responsiveness
- Client Issues
- Other Factors
- Measuring by Hand: Developer Tools
- Places and Tasks in User Experience
- Conclusions
- 9. Could They Do It?: Synthetic Monitoring
- Monitoring Inside the Network
- Monitoring from Outside the Network
- Different Tests for Different Tiers
- Beyond a Simple GET: Compound Testing
- Configuring Synthetic Tests
- Aggregation and Visualization
- Advantages, Concerns, and Caveats
- Synthetic Monitoring Maturity Model
- 10. Could They Do It?: Real User Monitoring
- RUM and Synthetic Testing Side by Side
- How We Use RUM
- Capturing End User Experience
- Deciding How to Collect RUM Data
- RUM Reporting: Individual and Aggregate Views
- RUM Concerns and Trends
- Real User Monitoring Maturity Model
- 8. Could They Do It?: End User Experience Management
- IV. Online Communities, Internal Communities, and Competitors
- 12. Why Care About Communities?
- 13. The Anatomy of a Conversation
- The Participants: Who’s Talking?
- The Topics: What Are They Talking About?
- The Places: Where Are They Talking?
- 14. Tracking and Responding
- Searching a Community
- Joining a Community
- Moderating a Community
- Running a Community
- Putting It All Together
- Measuring Communities and Outcomes
- Reporting the Data
- Responding to the Community
- Community Listening Platforms
- Community Monitoring Maturity Model
- 15. Internally Focused Communities
- 16. What Are They Plotting?: Watching Your Competitors
- Watching Competitors’ Sites
- Do I Have Competitors I Don’t Know About?
- Are They Getting More Traffic?
- Do They Have a Better Reputation?
- Are Their Sites Healthier Than Mine?
- Is Their Marketing and Branding Working Better?
- Are Their Sites Easier to Use or Better Designed?
- Have They Made Changes I Can Use?
- Preparing a Competitive Report
- Competitive Monitoring Maturity Model
- V. Putting It All Together
- 17. Putting It All Together
- 18. What’s Next?: The Future of Web Monitoring
- A. KPIs for the Four Types of Site
- Tailoring the Monitoring Mix to Media Sites
- How Much Did Visitors Benefit My Business?
- Where Is My Traffic Coming from?
- What’s Working Best (and Worst)?
- How Good Is My Relationship with My Users?
- How Healthy Is My Infrastructure?
- How Am I Doing Against the Competition?
- Where Are My Risks?
- What Are People Saying About Me?
- How Are My Site and Content Being Used Elsewhere?
- Tailoring the Monitoring Mix to Media Sites
- Tailoring the Monitoring Mix to Collaborative Sites
- How Much Did Visitors Benefit My Business?
- Where Is My Traffic Coming from?
- What’s Working Best (and Worst)?
- How Good Is My Relationship with My Users?
- How Healthy Is My Infrastructure?
- How Am I Doing Against the Competition?
- Where Are My Risks?
- What Are People Saying About Me?
- How Are My Site and Content Being Used Elsewhere?
- Tailoring the Monitoring Mix to SaaS Sites
- How Much Did Visitors Benefit My Business?
- Where Is My Traffic Coming from?
- What’s Working Best (and Worst)?
- How Good Is My Relationship with My Users?
- How Healthy Is My Infrastructure?
- How Am I Doing Against the Competition?
- Where Are My Risks?
- What Are People Saying About Me?
- How Are My Site and Content Being Used Elsewhere?
- Index
- Colophon
We’ve seen several examples of how synthetic tests report data. Let’s look at a few other common representations of end user experience. One way of reporting performance is to segment it by region or carrier to identify the worst-served parts of the Internet, as shown in Figure 9-28.

Figure 9-28. Webmetrics transaction performance report by geographic region for a site on the East Coast of North America
Segmented reports show you the slowest or least-available tests along a particular dimension. But what if you want to focus on a particular element of latency? Synthetic tests collect a great deal of data, and you need to look across all of it to properly understand what normal performance is like.
By displaying a metric—such as total transaction time—as a histogram, you can quickly see what kind of performance is most typical. On the other hand, you may not want to aggregate data, but rather see individual tests to better understand a particular period of time. In this case, a scatterplot visualization like the one shown in Figure 9-29 works well.
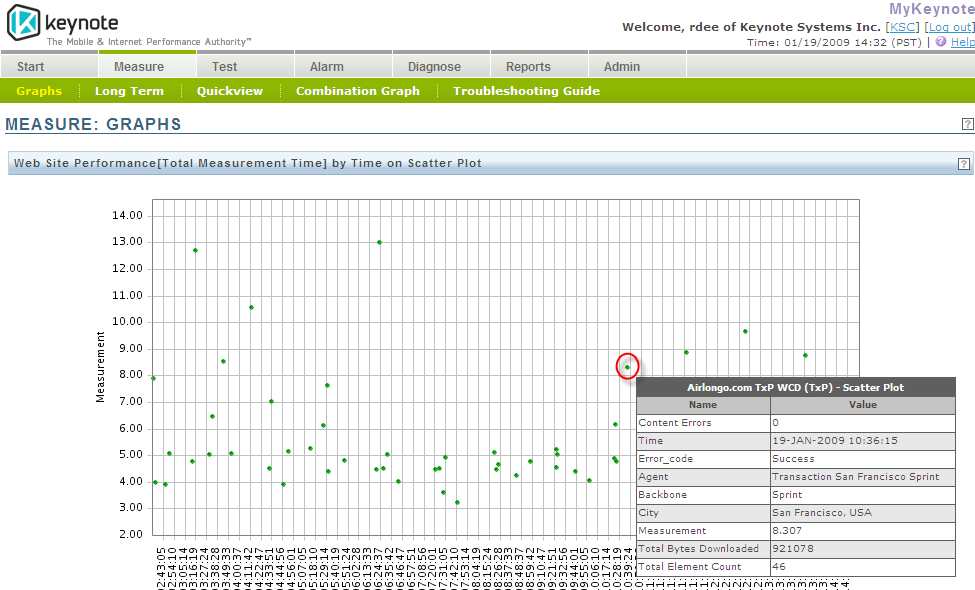
This kind of report is only available from services that keep the raw test data for considerable lengths of time. Some lower-cost services will aggregate this information into averages to reduce their storage requirements.
Finally, matrix reports are ways of comparing two segments to one another. In the case of Figure 9-30, these segments are locations and websites.
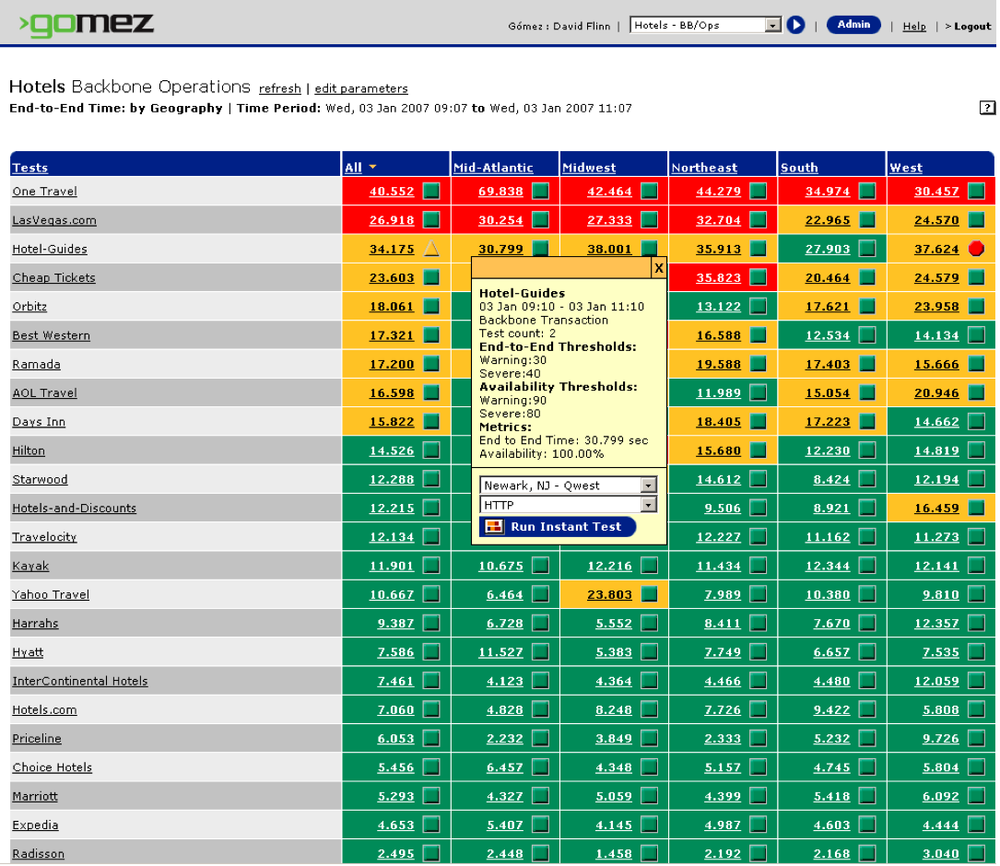
Matrix reports are useful for identifying problem areas at a glance, such as two carriers that aren’t forwarding packets to one another well. From a matrix report you can drill into the history of a specific region or site.
As you define and prepare these reports, be sure to share them with managers and members of other monitoring groups, including marketing, QA, and web design, to accustom them to the information that synthetic monitoring can provide.
-
No Comment