
Slow page loads or excessive downtime can undermine even the best-designed, most effective, easiest-to-use website. While web analytics shows you what people are doing on your site; end user monitoring shows you whether they could do it—and how quickly they did it.
The most basic metrics for web health are availability (is it working?) and performance (how fast is it?), sometimes referred to collectively as performability. These can be measured on a broad, site-wide basis by running synthetic tests at regular intervals; or they can be measured for every visit to every page with real user monitoring (RUM).
In general, availability (the time a site is usable) is communicated as a percentage of tests that were able to retrieve the page correctly. Performance (how long the user had to wait to interact with the site) is measured in seconds to load a page for a particular segment of visitors.
What to watch: Availability from locations where visitors drive revenue; page load time for uncached and cached pages; end-to-end and host time at various traffic volumes; changes in performance and availability over time or across releases.
If people pay to use your site, you have an implied contract that you’ll be available and usable. While this may not be a formal Service Level Agreement (SLA), you should have internal guidelines for how much delay is acceptable. Some SaaS providers, such as Salesforce.com, show current uptime information to subscribers and use this as a marketing tool (see Figure 3-7).

A properly crafted SLA includes not only acceptable performance and availability, but also time windows, stakeholders, and which functions of the website are covered.
Your SLAs may also depend on your partners, so you may have to consider other SLAs when measuring your own. If, for example, your site is part of a web supply chain, you need to measure the other links in that chain to know whether you’re at fault when an SLA is missed.
Measure and report the metrics that comprise an SLA in a regular fashion to both your colleagues and your customers.
What to watch: SLA metrics against agreed-upon targets; customers or subscribers whose SLAs were violated.
Measuring the delivery of simple, static advertising was once straightforward: if the browser received the page, the user saw the ad. With the advent of interactive advertising and video, however, delivery to the browser no longer means visibility to the user.
Content delivery is important for media companies. A Flash ad may be measured for its delivery to the browser, whether its sites were within the visible area of the browser, and whether the visitor’s mouse moved over it. Users may need to interact with the content—by rolling over the ad, clicking a sound button, and so on. Then the ad plays and the user either clicks on the offer or ignores it. This means each interactive ad has its own abandonment process.
The provider that served the ad tracks this. The Flash content sends messages back about engagement, abandonment, and conversion. As a result, media site operators don’t need to treat this content differently from static advertising.
While rich media often requires custom analytics, there’s one kind of embedded media that’s quickly becoming mainstream: Web video. David Hogue of Fluid calls it “the new JPEG,” a reflection of how commonplace it is on today’s sites.
While there are a variety of companies specializing in video analytics (such as Visible Measures, divinity Metrics, Streametrics, TubeMogul, and Traackr), embedded video is quickly becoming a part of more mainstream web analytics packages. It is also becoming a feature of many content delivery network (CDN) offerings that specialize in video.
Most for-pay analytics offerings available today allow a video player to send messages back to the analytics service when key events, such as pausing or rewinding, take place, as shown in Figure 3-8.

Figure 3-8. Vstat by Streametrics captures information such as average viewing time, geolocation, referrers, and so on
Embedded video serves many purposes on websites. Sometimes it’s the reason for the site itself—the content for which visitors come in the first place. Sometimes it’s a form of advertising, tracked by the ad network that served it. Sometimes it’s a lure to draw the visitor deeper into the site. In each case, what you measure will depend on your site.
What to watch: Content engagement; attention; completion of the media; pauses.
When a community suddenly discovers content that it likes, the result is a flash crowd. A mention by a popular blogger, breaking news, or upvoting on a social news aggregator can send thousands of visitors to your website in seconds.
For most websites, capacity and bandwidth is finite. When servers get busy and networks get congested, performance drops. The problem with flash crowds is that they last for only a few hours or days—after that, any excess capacity you put in place is wasted. One of the attractions of CDNs and on-demand computing infrastructure is the ability to “burst” to handle sudden traffic without making a long-term investment in bandwidth or hardware.
When you’re on the receiving end of a flash crowd, there’s a lot to do. Marketing needs to engage the one-time visitors, making them loyal and encouraging them to subscribe or return. IT operators need to ensure that there’s enough capacity, working with service providers or provisioning additional resources if applicable. And community managers need to identify the source of the traffic so they can nurture and prolong the attention.
While flash crowds create dramatic bursts of traffic, a gradual, sustained increase in traffic can sneak up on you and consume all available capacity. You need to monitor long-term increases in page latency or server processing or decreases in availability that may be linked to increased demand for your website.
Analytics is a good place to start: IT operators should correlate periods of poor performance with periods of high traffic to bandwidth- or processor-intensive parts of the site. If there’s a gradual increase in the volume of downloads, you should plan for additional bandwidth. Similarly, if there’s a rise in transaction processing, you may need more servers.
Too often, IT operations and web analytics teams don’t talk. The result is last-minute additions to capacity rather than planned, predictable spending.
What to watch: Sudden increases in requests for content; referring URLs; search engine results that reference the subject or the company; infrastructure health metrics; growth in large-sized content or requests for processor-intensive transactions
While you can measure the impact of visitors on performance, it’s equally important to measure the impact of performance on visitors. Poor performance has a direct impact on outcomes like conversion rate, as well as on user productivity. Google and Amazon both report a strong correlation between increased delay and higher bounce rates or abandonment, and responsive websites encourage users to enter a "flow state" of increased productivity, while slow sites encourage distraction.
The relationship between performance and conversion can be measured on an individual basis, by making performance a metric that’s tracked by analytics and by segmenting conversion rates for visitors who had different levels of page latency, as shown in Figure 3-9.

However, this can be hard to do unless you have a way of combining web analytics with the experience of individual end users.
Another way to understand the impact of performance is to compare aggregate page latency with aggregate conversion metrics, as shown in Figure 3-10. To do this properly, you need to eliminate any other factors that may be affecting conversion, such as promotions, daily spikes, or seasonal sales increases.
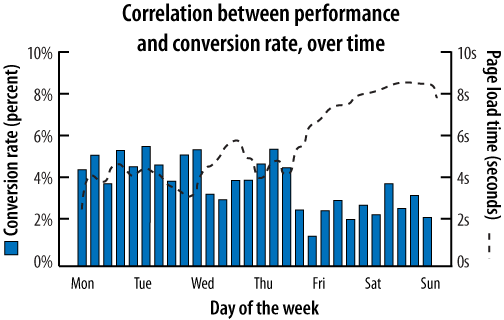
The fundamental question we want to answer is: does a slow user experience result in a lower conversion rate or a reduced amount of upselling?
What to watch: Conversion rates segmented by tiers of page latency; daily performance and availability summaries compared with revenue and conversion; revenue loss due to downtime.
Marketing campaigns should drive site traffic. You need to identify the additional volume of visitors to your site not only for marketing reasons, but also to understand the impact that marketing promotions have on your infrastructure and capacity.
Properly constructed campaigns have some unique identifier—a custom URL, a unique referrer ID, or some other part of the initial request to the site—that lets you tie it back to a campaign. This is used to measure ad and campaign effectiveness. You can use the same data to measure traffic volumes in technical terms—number of HTTP sessions, number of requests per second, megabits per second of data delivered, availability, and so on.
Pay particular attention to first-time visitors. They place a greater load on the network (because their browsers have yet to cache large objects) and on applications because of enrollment, email registration, and other functions that occur when a visitor first arrives.
What to watch: Traffic by marketing campaign alongside infrastructure health metrics, such as availability or performance, on as granular a level as possible (ideally per-visit). A summary similar to the one shown in Figure 3-11 is ideal.

If your business is highly seasonal, you need to understand historical usage patterns. The fates of firms like Hallmark and ProFlowers are tied to specific holidays—indeed, at ProFlowers, so much of of the company’s transactions happen on Valentine’s Day that they refer to it internally as “V-day.”
Seasonal usage isn’t really a new metric, but it’s a requirement for monitoring in general. If you’re allowed to, collect at least five quarters of data so you can compare each month to the same month of the previous year. You’re doing this for two reasons: to understand usage trends so you can plan for capacity changes, and to confirm that you’re meeting long-term SLAs.
You only need to store aggregate data, such as hourly performance and availability, for this long. Indeed, many governments and privacy organizations are looking more closely at the long-term storage of personal information, and some sites have a deletion policy that may limit your ability to capture long-term trends.
What to watch: Page views; performance, availability, and volume of CPU-intensive tasks (like search or checkout) on a daily basis for at least 15 months.