
Computer resources are the gasoline for running applications and, therefore, they should be one of the main worries of a game programmer. Most software come with a system requirements list that draws the line between a computer that runs it properly and another one that doesn't. Testing your application on a wide range of target systems is a good practice but it is not the only one.
VisualVM is a free tool to view real-time detailed information about Java programs through an intuitive interface. It brings with it monitoring charts, threads breakdown, and some other utilities to profile your application.
It can help you to optimize slow games, improving the game experience, or even widen your target audience.
You will need to have a Java project on hand to fit the requirements of this recipe. For example, sample-desktop can be a good candidate to import into your Eclipse workspace.
In addition, once you have JDK 7 running on your system, a VisualVM distribution must be downloaded from its official website at the following link:
http://visualvm.java.net/download.html
In order to integrate VisualVM with Eclipse, download its plugin from the following link:
http://visualvm.java.net/eclipse-launcher.html
Do not forget to unzip both of them before going any further.
The process of installation and integration of VisualVM within your development environment is not fully automatic. Several manual steps must be performed prior to monitoring and profiling your application.
Starting from locating the aforementioned folders, follow the upcoming indications to integrate VisualVM into your Eclipse IDE. Perform the following steps:
- Go to Help | Install New Software. Click on Add | Local and select the extracted plugin folder. Give it a name and click on OK.
- Enable the VisualVM Launcher Feature checkbox. Click on Next twice, accept the license, and click on Finish.
This will add a new configuration tab that can be accessed through the following:
- Go to Window | Preferences. Enter Run/Debug | Launching | VisualVM Configuration and set VisualVM Executable to the
visualvm.exefile placed within thebinfolder of your VisualVM directory. - You must also enter the JDK 7 directory.
Once VisualVM is properly linked to your IDE, we must find a way to specify whether the default or the VisualVM launcher will take the responsibility of starting the application. Perform the following steps:
- Go to Run | Run Configurations and click on the new launch configuration button while having selected the Java Application item from the list on the left-hand side.

New launch configuration button
- Give it a name and set the
sample-desktopproject together with itsmainclass. Remember to change its working directory toandroid-sample/assets. - Now that the configuration is set up, you should see the following message in the lower part of the present dialog:

- Click on Select one…, make sure to check the Use configuration specific settings option and then select VisualVM Launcher. Click on OK to save this change.
- Finally, you are ready to click on the Run button in order to launch your application parallel to its own tab within the VisualVM interface, as shown in the following screenshot:
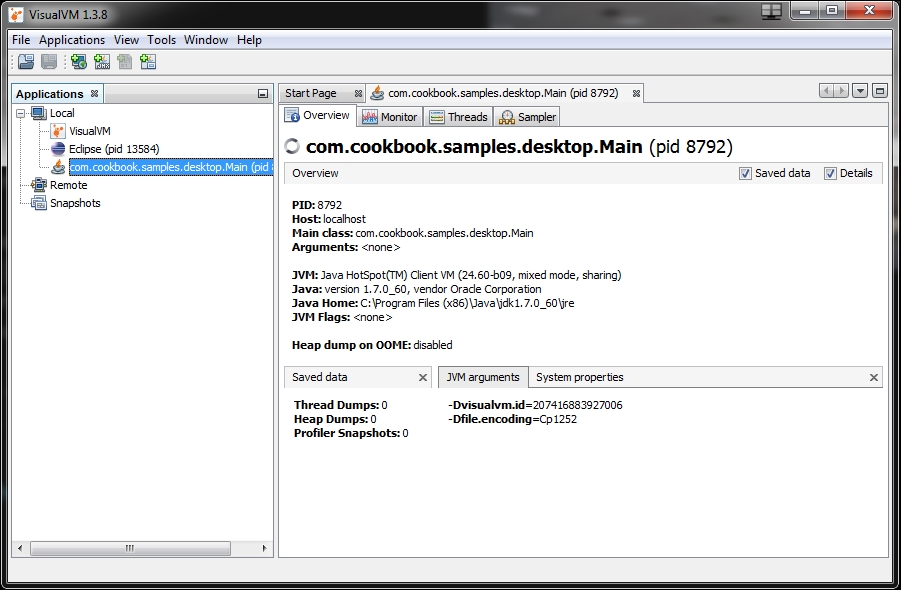
The VisualVM interface is not too bloated so you can focus on what is truly important. As you can observe in the previous screenshot, inside of the Applications tab, you can double-click on the cookbook application that is running. This will have an immediate effect on the main frame, showing real-time information split into the following sections that can be accessed through the tabs at the top of the aforementioned frame:
- Monitor: A general overview of your application resources consumption is displayed through four fancy charts:
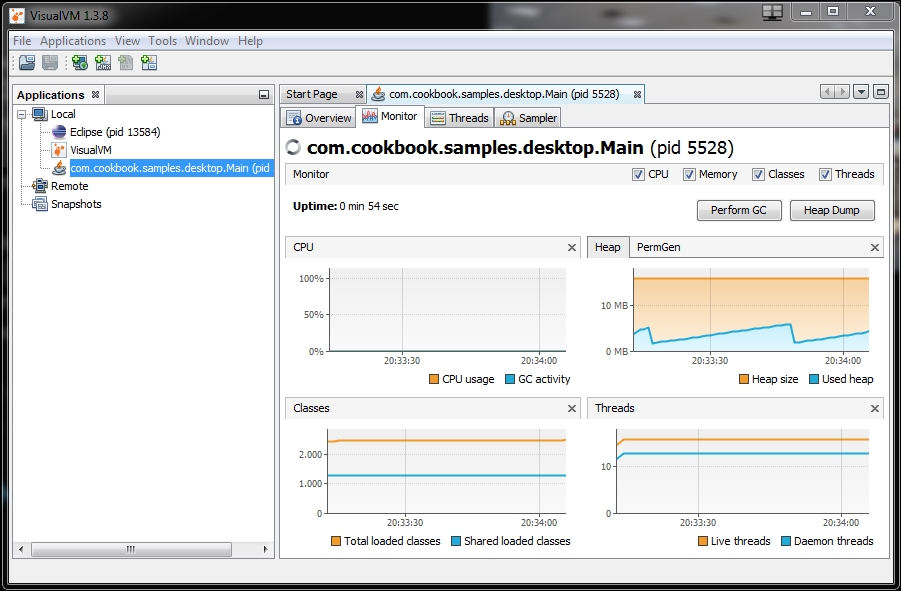
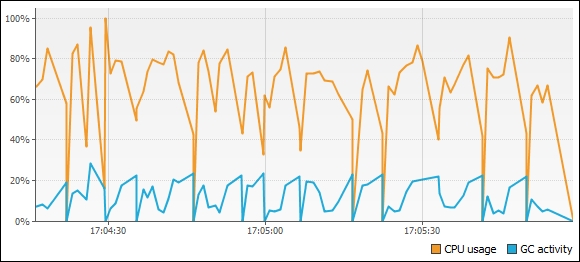
A quick look allows you to find out the ratio CPU usage or the garbage collector (GC) activity which must be minimized as much as possible since, otherwise, they can produce short freezes in your game. The following screenshot illustrates high GC activity:
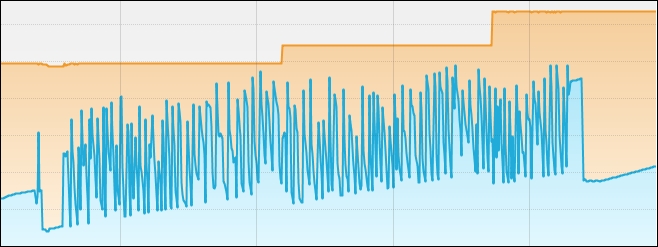
It also displays the number of loaded classes, the number of threads in use, and the allocated memory. This last indicator has two graphs because of the different JavaVM memory spaces:
This chart with condensed memory information makes it easier to find leaks. You will easily identify them since they usually have a tooth-like appearance, shown in the following screenshot:
- Threads: A timeline with the threads life cycle is shown, tinting each of them with a color according to its state (green, purple, yellow, and orange for running, sleeping, wait, and monitor states, respectively), as shown in the following screenshot:
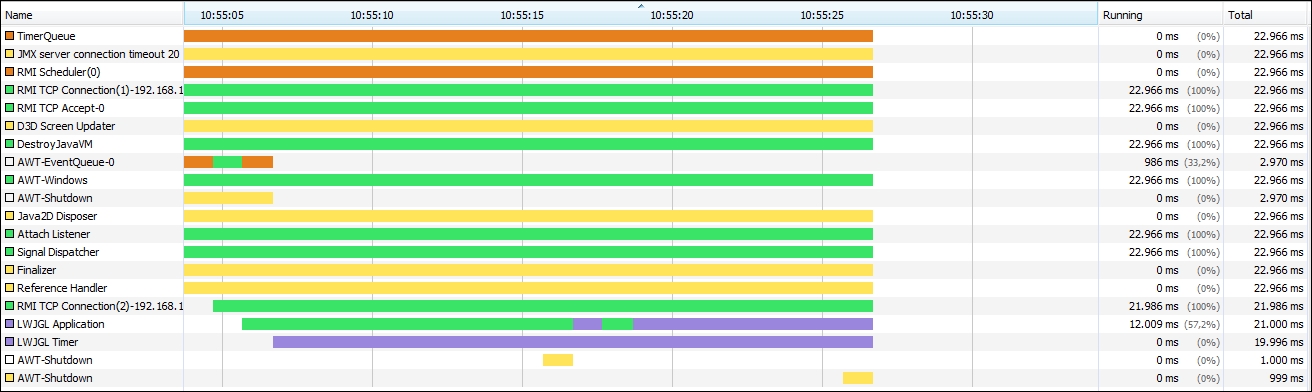
More information about the states can be found in the official Java documentation at http://docs.oracle.com/javase/7/docs/api/java/lang/Thread.State.html.
If you play around with the VisualVM interface, you will realize that it lists the number of normal and daemon threads. The main difference between them is that the last ones are abandoned when JVM terminates, which means that they are good candidates for doing housekeeping tasks.
- Sampler/Profiler: This option allows you to obtain more specific information related to either the CPU or the memory. Sampling means analyzing stack traces, while profiling is instrumenting your code so classes and methods broadcast whenever they are executed. Intuitively, the first one is faster but less accurate than the second one.
The Startup Profiler plugin must be installed by navigating to Tools |Plugins| Available Plugins | Startup Profiler | Install. After this, you must restart for the Profiler tab to become available. Moreover, you will have to calibrate the profiler before using it for the first time.
Next, we'll cover a more specific description about the two different sample types:
- CPU samples: This shows the detailed performance data on method or thread level. CPU samples are shown in the following screenshot:
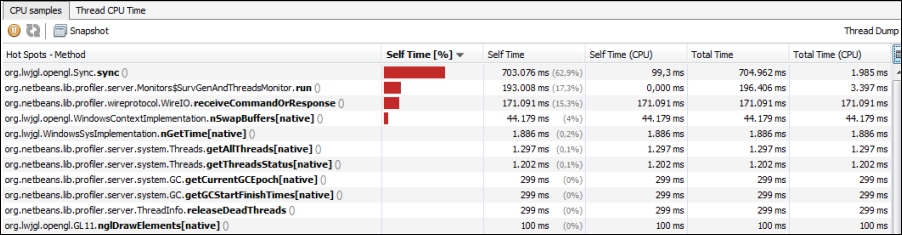
It can be quite interesting to detect bottlenecks. A clear example is shown in the following screenshot where a method call takes most of the execution time:
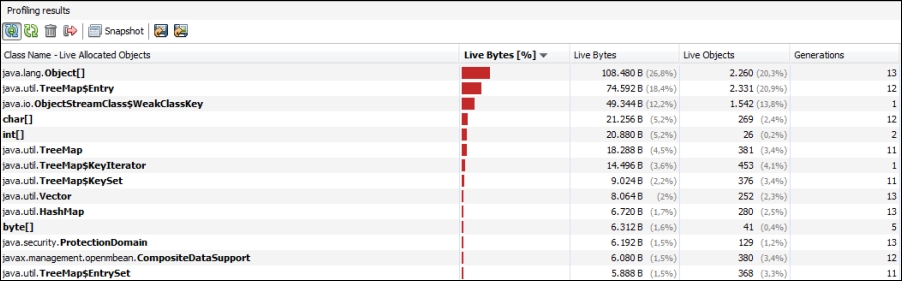
- Memory samples: All the classes that have allocated objects are listed together with their amount of bytes taken and the number of instances, as shown in the following screenshot:
- CPU samples: This shows the detailed performance data on method or thread level. CPU samples are shown in the following screenshot:
- Threads: A timeline with the threads life cycle is shown, tinting each of them with a color according to its state (green, purple, yellow, and orange for running, sleeping, wait, and monitor states, respectively), as shown in the following screenshot:
Sometimes, you might want your application to freeze in an exact moment of execution so that the specific context can be calmly analyzed. To this effect, you can take a snapshot of your application, heap dumps, and thread dumps, which can be saved and loaded at any time.
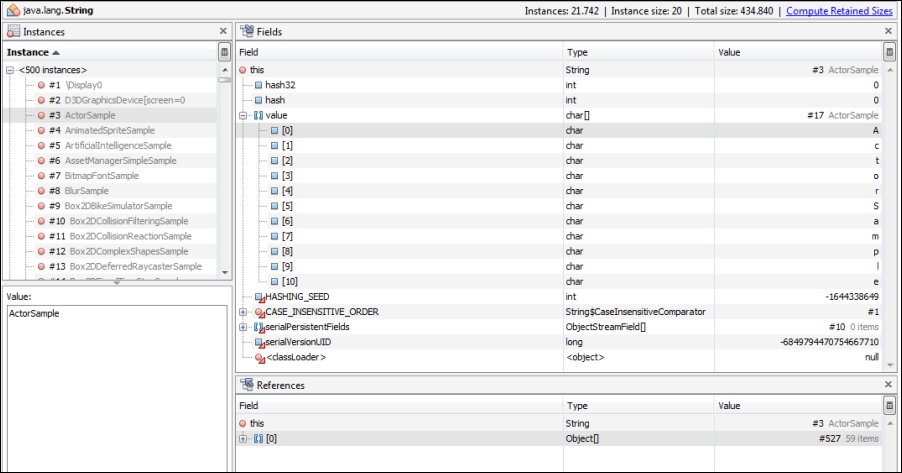
Heap dumps are particularly interesting because if you double-click on a class, the interface will show you a rich source of valuable information about all the instances of the classes, as shown in the following screenshot:
Profiling is achieved through an underlying process consisting in adding byte-codes to methods in order to gather data without modifying the behavior of your application. Some of this information is the space (memory), the time, the usage of particular instructions, the frequency, and duration of function calls.
More information is given within the official Java Instrumentation interface at the following link:
http://docs.oracle.com/javase/7/docs/api/java/lang/instrument/Instrumentation.html
VisualVM is not only useful for local applications but you can monitor and profile remote ones.
The process is quite similar except for the connection steps. Perform the following steps:
- Go to File | Add Remote Host.
- Enter the IP address or name of your remote host.
- Give it a name and click on OK.
All Java applications running on the given system will appear within the Remote section of the Applications menu.