
Data frames and matrices are easy-to-use objects in R, with typical manipulations that execute quickly on datasets with a reasonable size. However, problems can arise when the user needs to handle larger data sets. In this section, we will illustrate how the bigmemory and biganalytics packages can solve the problem of too large datasets, which is impossible to handle by data frames or data tables.
In the following example, we will perform K-means clustering on large datasets. For illustrative purposes, we will use the Airline Origin and Destination Survey data of the U.S. Bureau of Transportation Statistics. The datasets contain the summary characteristics of more than 3 million domestic flights, including the itinerary fare, number of passengers, originating airport, roundtrip indicator, and miles flown, in a csv format.
Reading dataset from csv files can be easily executed by the read.csv() file. However, when we have to handle larger datasets, the reading time of any file can become quite substantial. With some careful options, however, the data-loading functionality of R can be significantly improved.
One option is to specify correct types in colClasses = argument when loading data to R; this will result in a faster conversion of external data. Also, the NULL specification of columns that are not needed for the analysis can significantly decrease the time and memory consumed to load the data.
However, if the dataset reaches the RAM threshold of the computer, we need to adopt more memory-efficient data-leading options. In the following example, we will show how the bigmemory package can handle this task.
First of all, we will install and load the required bigmemory and biganalytics packages to perform the K-means cluster analysis on big data:
install.packages("bigmemory")
install.packages("biganalytics")
library(bigmemory)
library(biganalytics)
We used the read.big.matrix function to import the downloaded dataset in R from the local system. The function handles data not as a data frame but as matrix-like objects, which we need to turn into a matrix with the as.matrix function:
x<-read.big.matrix( "FlightTicketData.csv", type='integer', header=TRUE, backingfile="data.bin",descriptorfile="data.desc")
xm<-as.matrix(x)
nrow(x)
[1] 3156925
The format of the big data K-means function in R is bigkmeans (x, centers), where x is a numeric dataset (big data matrix object), and centers is the number of clusters to extract. The function returns the cluster memberships, centroids, within cluster sum of squares (WCSS), and cluster sizes. The bigkmeans() function works either on regular R matrix objects or on big.matrix objects.
We will determine the number of clusters based on the percentage of variance explained by each cluster; therefore, we will plot the percentage of variance explained by the clusters versus the number of clusters:
res_bigkmeans <- lapply(1:10, function(i) {
 bigkmeans(x, centers=i,iter.max=50,nstart=1)
 })
lapply(res_bigkmeans, function(x) x$withinss)
var <- sapply(res_bigkmeans, function(x) sum(x$withinss))
plot(1:10, var, type = "b", xlab = "Number of clusters", ylab = "Percentage of variance explained")
The following screenshot displays the output of the preceding code:
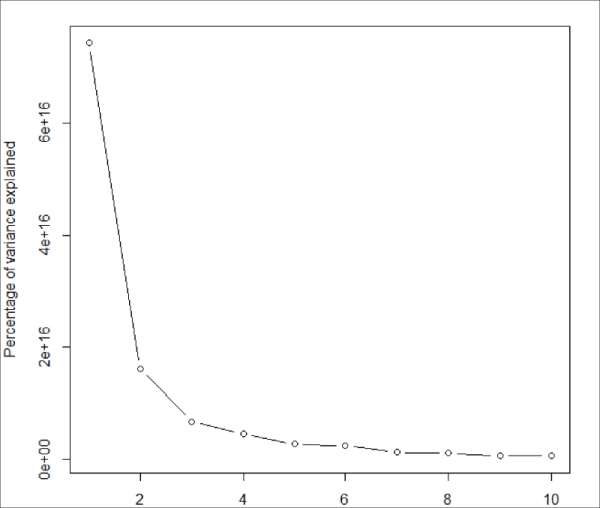
Figure 4.4: Plot the within cluser sums of squares versus the number of clusters extracted
The sharp decrease from 1 to 3 clusters (with little decrease thereafter) suggests a three-cluster solution. Therefore, we will perform the big data K-means cluster analysis with three clusters:
res_big<-bigkmeans(x, centers=3,iter.max=50,nstart=1)
res_big
K-means clustering with 3 clusters of sizes 919959, 1116275, 1120691

Cluster means:
         [,1]     [,2]    [,3]     [,4]      [,5]       [,6]     [,7]     [,8]
[1,] 2.663235 12850.78 1285081 32097.61 0.6323662 0.03459393 2.084982 2305.836
[2,] 2.744241 14513.19 1451322 32768.11 0.6545699 0.02660276 1.974971 2390.292
[3,] 2.757645 11040.08 1104010 30910.66 0.6813850 0.03740460 1.989817 2211.801
         [,9]
[1,] 1.929160
[2,] 1.930394
[3,] 1.949151

Clustering vector:
[1] 3 3 3 3 3 3 1 1 1 1 1 1 1 1 1 1 1 1 1 2 2 2 2 2 2 2 2 3 3 3 3 3 3 3 3 3
[37] 3 3 3 3 3 3 3 3 3 3 1 1 1 1 1 1 2 2 2 2 3 3 3 3 3 1 1 1 1 1 1 1 1 1 1 1
[73] 1 2 2 2 2 2 2 3 3 3 1 2 2 3 3 3 1 1 1 1 1 1 2 2
Within cluster sum of squares by cluster:
[1] 2.010160e+15 2.466224e+15 2.183142e+15

Available components:

[1] "cluster"  "centers"  "withinss" "size"
The bigkmeans() function also works with ordinary matrix objects, offering a faster calculation than the kmeans() function.
To test this hypothesis, we will measure the average execution time of the bigkmeans() and kmeans() functions with different dataset sizes:
size<-round(seq(10,2500000,length=20))
nsize<-length(size)
calc.time <- matrix(NA, nrow=nsize, ncol=2)
for (i in 1:nsize) {
 size.i<-size[i]
 xm.i<-xm[1:size.i,]
vec1=rep(0,10)
vec2=rep(0,10)
for (j in 1:10) {
vec1[j]<-system.time(kmeans(xm.i,centers=3,iter.max=50,nstart=1))[3]
vec2[j]<-system.time(bigkmeans(xm.i,centers=3,iter.max=50,nstart=1))[3]
}
calc.time[i,1]<-mean(vec1)
calc.time[i,2]<-mean(vec2)
}
The following screenshot displays the output of the preceding code:
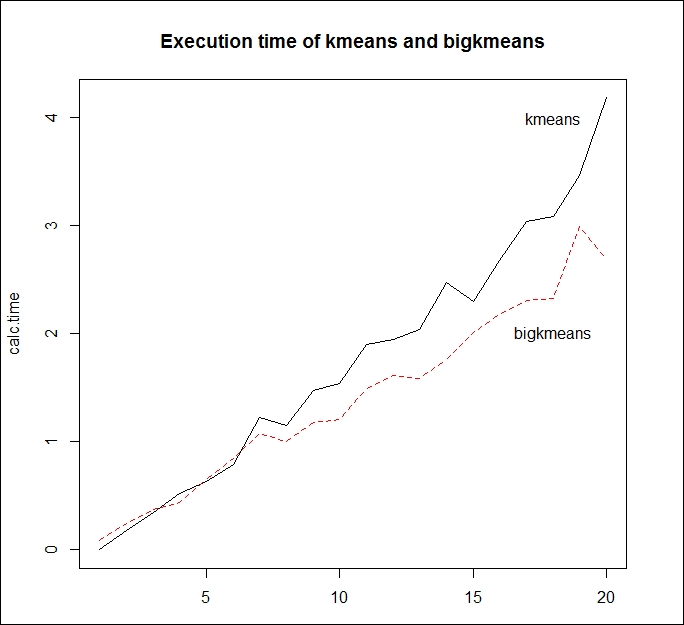
Figure 4.5: Execution time of the kmeans() and bigkmeans() function according to the size of the dataset
Calculating the average execution time of the two functions takes substantial time. The preceding figure, however, reveals that bigkmeans() works more efficiently with larger datasets than the kmeans() function, thus reducing the calculation time of R in the analysis.