
Let's follow a different logic to develop decision rules so that we can contrast the two results later. Let's select which shares offered the best returns. Decision or classification trees are great for this purpose. Here, R will pick from the given list of variables those that can create the most effective decision rules. Instead of building joint rules, like we did previously, first, it selects the variable using which we may create subgroups of the shares regarding their TRS. Then, for each of these subgroups, it will choose the second most effective variable and so on. The output is a kind of decision tree:
d_tree <- d[,c(3:17,19)]
vars <- colnames(d_tree)
m <- length(vars)
tree_formula <- paste(vars[m], paste(vars[-m], collapse = " + "), sep = " ~ ")
library(rpart)
tree <- rpart(formula = tree_formula, data = d_tree, maxdepth = 5 ,cp = 0.001)
tree <- prune(tree, cp = 0.003)
par(xpd = T)
plot(tree)
text(tree, cex = .5, use.n = T, all = T)
In our case, the resulting tree has five levels, as you can see in the next figure. In each node, we get the indication of the average TRS for the created subgroups. The decision rule is also indicated: if the logical statement is true, go down on the branch to the left; if it is false, you will follow the right branch. As seen here, we will focus only on high return possibilities. We have to check the bottom of the tree to see what subgroups were created and which of them would show a particularly high TRS:
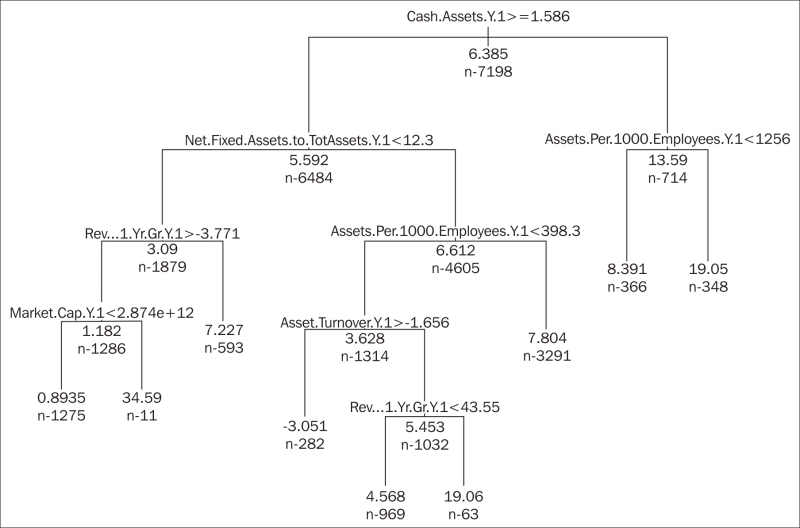
Our database ended up with three subgroups with particularly high-average TRS. Based on the tree, we have to check the Cash/Assets ratio first.
Firms with a ratio higher than (or equal to) 1.6 percent should be divided further based on the net fixed assets / total assets. If the ratio is above 12.3 percent and the asset/employee rate is below 398, plus the asset turnover is lower than 1.66, we only need to be sure that the 1 year growth of the revenue for the previous year was above 43.5 percent to get a subgroup of 63 firms with an average TRS of 19 percent.
If the Cash/Assets is above (or equal to) 1.6 percent and the net fixed assets / total assets ratio is below 12.3 percent, we need to look for the yearly growth of the revenue for the previous year. For the 11 companies where that ratio is above 3.77 percent and the market capitalization exceeds 2874 billion dollars, we will find an average TRS of 34.6 percent.
There is also a third group of overperformers. The 348 firms with a cash ratio lower than 1.6 and the companies with an asset/employee rate higher than 2156 generated an average TRS of 19 percent.
Considering the number of elements in these three groups compared to the total number of firms being analyzed, the first and the last one may offer us a realistic investment strategy. The group with 11 companies only represents 0.15 percent of the total, and so, it may be the result of random or unexpected events.
So, to sum this up, a high cash ratio (over 1.6) should go hand in hand with higher than 12.3 percent fixed asset ratio, an asset/employee value below 398, an asset turnover below 1.66, and a yearly revenue growth for the previous year exceeding 43.5 percent. If your cash ratio is lower than 1.6, asset/employee should be higher than 2156 to pick shares from our portfolio.
Notice that here, only five variables are included in our investment decision program, while previously, a constellation of eight variables was set up. Also, note that there are only three ratios (Cash/Assets, fixed assets ratio, and asset turnover), which are used in both of these decision processes. Our next step may be comparing the efficiency of the two methods.