
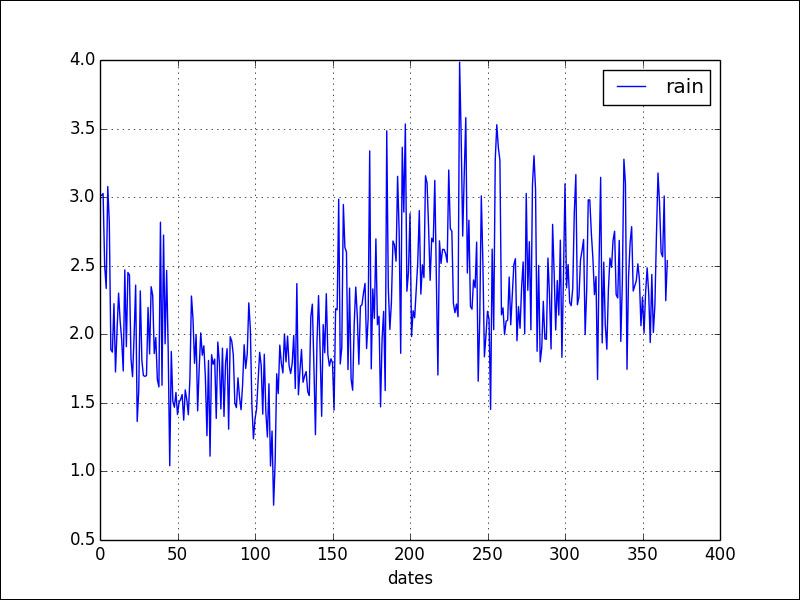
Mean Shift is another clustering algorithm that doesn't require an estimate for the number of clusters. It has been successfully applied to image processing. The algorithm tries to iteratively find the maxima of a density function. Before demonstrating mean shift, we will average the rain data on a day-of-the-year basis using a pandas DataFrame. Create the DataFrame and average its data as follows:
df = pd.DataFrame.from_records(x.T, columns=['dates', 'rain'])
df = df.groupby('dates').mean()

df.plot()
The following plot is the result:
Cluster the data with the mean shift algorithm as follows:
x = np.vstack((np.arange(1, len(df) + 1) , df.as_matrix().ravel()))
x = x.T
ms = cluster.MeanShift()
ms.fit(x)
labels = ms.predict(x)
If we visualize the data with different line widths and shading for the three resulting clusters, the following figure is obtained:
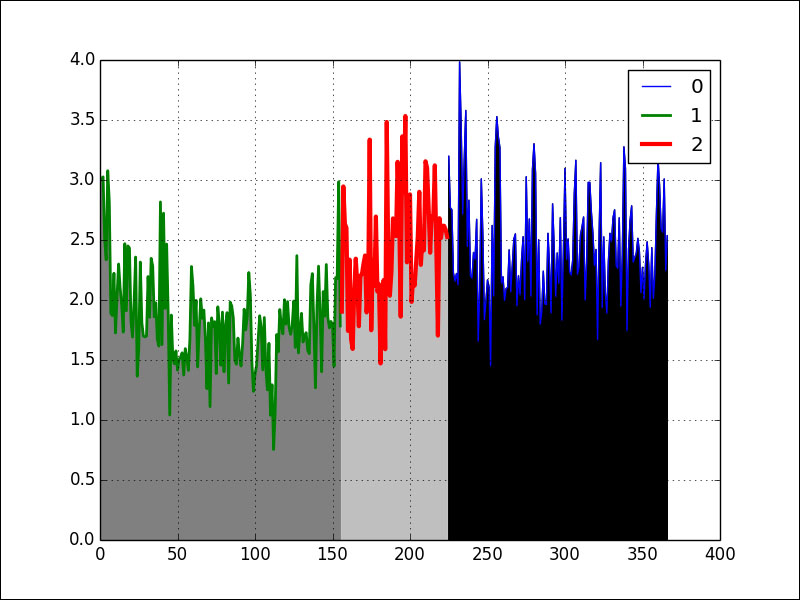
As you can see, we have three clusters based on the average rainfall in mm on the day of year (1-366). The complete code is in the mean_shift.py file in this book's code bundle:
import numpy as np
from sklearn import cluster
import matplotlib.pyplot as plt
import pandas as pd


rain = .1 * np.load('rain.npy')
rain[rain < 0] = .05/2
dates = np.load('doy.npy')
x = np.vstack((dates, rain))
df = pd.DataFrame.from_records(x.T, columns=['dates', 'rain'])
df = df.groupby('dates').mean()
df.plot()
x = np.vstack((np.arange(1, len(df) + 1) , df.as_matrix().ravel()))
x = x.T
ms = cluster.MeanShift()
ms.fit(x)
labels = ms.predict(x)

plt.figure()
grays = ['0', '0.5', '0.75']

for gray, label in zip(grays, np.unique(labels)):
    match = labels == label
    x0 = x[:, 0]
    x1 = x[:, 1]
    plt.plot(x0[match], x1[match], lw=label+1, label=label)
    plt.fill_between(x0, x1, where=match, color=gray)

plt.grid(True)
plt.legend()
plt.show()