
Filtering is a type of signal processing, which involves removing or suppressing a part of the signal. After applying FFT, we can filter high or low frequencies, or we can try to remove the white noise. White noise is a random signal with a constant power spectrum and as such doesn't contain any useful information. The scipy.signal package has a number of utilities for filtering. In this example, we will demonstrate a small sample of these routines:
- The median filter calculates the median in a rolling window (see http://en.wikipedia.org/wiki/Median_filter). It's implemented by the
medfilt()function, which has an optional window size parameter. - The Wiener filter removes noise using statistics (see http://en.wikipedia.org/wiki/Wiener_filter). For a filter
g(t)and signals(t), the output is calculated with the convolution(g * [s + n])(t). It's implemented by thewiener()function. This function also has an optional window size parameter. - The detrend filter removes a trend. This can be a linear or constant trend. It's implemented by the
detrend()function.
Please refer to the filtering.py file in this book's code bundle for the following code:
import statsmodels.api as sm
import matplotlib.pyplot as plt
from scipy.signal import medfilt
from scipy.signal import wiener
from scipy.signal import detrend
data_loader = sm.datasets.sunspots.load_pandas()
sunspots = data_loader.data["SUNACTIVITY"].values
years = data_loader.data["YEAR"].values
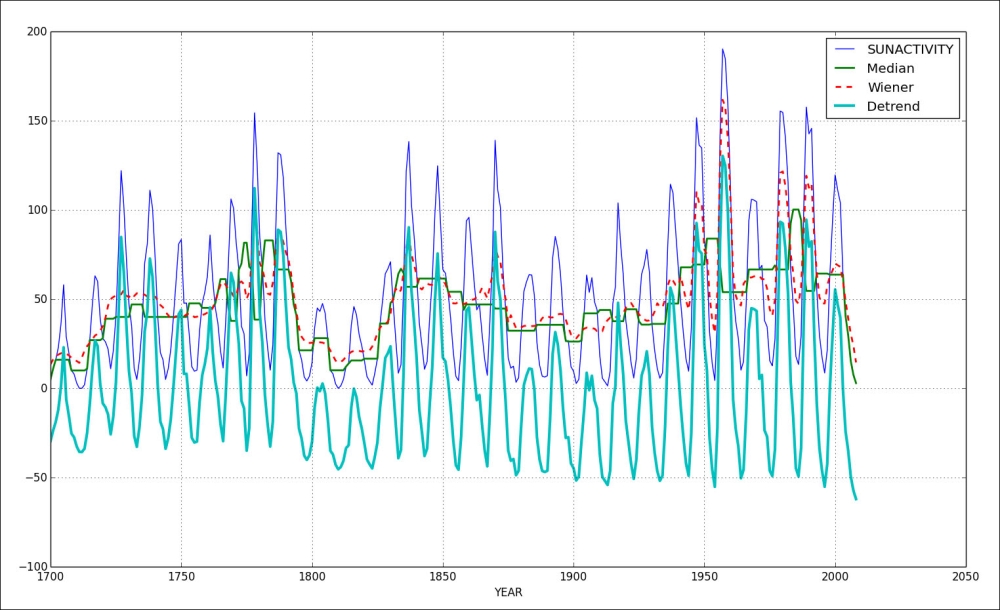
plt.plot(years, sunspots, label="SUNACTIVITY")
plt.plot(years, medfilt(sunspots, 11), lw=2, label="Median")
plt.plot(years, wiener(sunspots, 11), '--', lw=2, label="Wiener")
plt.plot(years, detrend(sunspots), lw=3, label="Detrend")
plt.xlabel("YEAR")
plt.grid(True)
plt.legend()
plt.show()Refer to the following graph for the end result:
..................Content has been hidden....................
You can't read the all page of ebook, please click here login for view all page.