NumPy has a number of window routines that can compute weights in a rolling window as we did in the previous section.
A window function is a function that is defined within an interval (the window) or is otherwise zero valued. We can use window functions for spectral analysis and filter design (for more background information, refer to http://en.wikipedia.org/wiki/Window_function). The boxcar window is a rectangular window with the following formula:
w(n) = 1
The triangular window is shaped like a triangle and has the following formula:
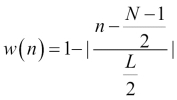
In the preceding formula, L can be equal to N, N+1, or N-1. In the last case, the window function is called the
Bartlett window. The Blackman window is bell shaped and defined as follows:
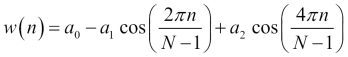
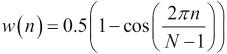
The Hanning window is also bell shaped and defined as follows:
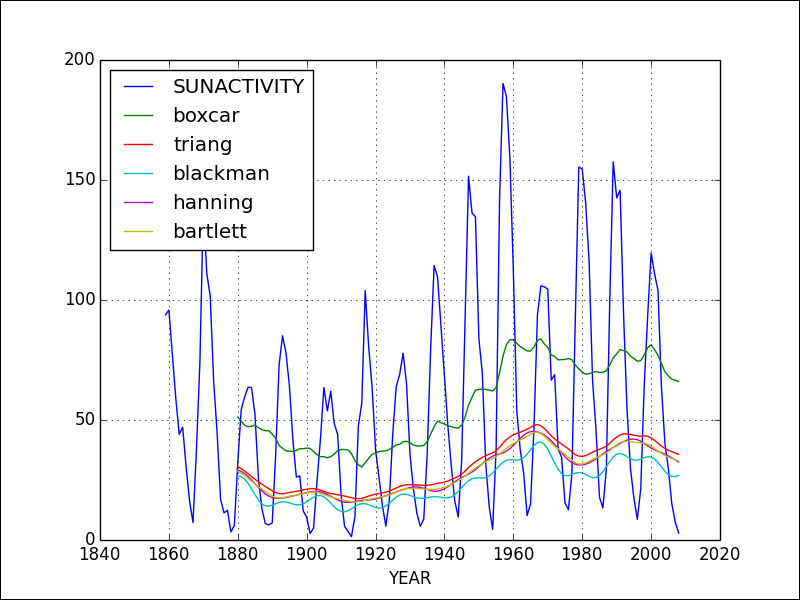
In the pandas API, the rolling_window() function provides the same functionality with different values of the win_type string parameter corresponding to different window functions. The other parameter is the size of the window, which will be set to 22 for the middle cycle of the sunspots data (according to research, there are three cycles of 11, 22, and 100 years). The code is straightforward and given in the window_functions.py file in this book's code bundle (the data here is limited to the last 150 years only for easier comparison in the plots):
import matplotlib.pyplot as plt
import statsmodels.api as sm
from pandas.stats.moments import rolling_window
import pandas as pd

data_loader = sm.datasets.sunspots.load_pandas()
df = data_loader.data.tail(150)
df = pd.DataFrame({'SUNACTIVITY':df['SUNACTIVITY'].values}, index=df['YEAR'])
ax = df.plot()

def plot_window(win_type):
    df2 = rolling_window(df, 22, win_type)
    df2.columns = [win_type]
    df2.plot(ax=ax)

plot_window('boxcar')
plot_window('triang')
plot_window('blackman')
plot_window('hanning')
plot_window('bartlett')
plt.show()
Refer to the following plot for the end result: