NumPy attempts to execute a procedure even though the operands do not have the same shape.
In this recipe, we will multiply an array and a scalar. The scalar is broadened to the shape of the array operand and then the multiplication is executed. The process described here is called
broadcasting. The following is the entire code for this recipe (refer to broadcasting.py in this book's code bundle):
import scipy.io.wavfile
import matplotlib.pyplot as plt
import urllib2
import numpy as np

response = urllib2.urlopen('http://www.thesoundarchive.com/austinpowers/smashingbaby.wav')
print response.info()
WAV_FILE = 'smashingbaby.wav'
filehandle = open(WAV_FILE, 'w')
filehandle.write(response.read())
filehandle.close()
sample_rate, data = scipy.io.wavfile.read(WAV_FILE)
print "Data type", data.dtype, "Shape", data.shape
plt.subplot(2, 1, 1)
plt.title("Original")
plt.plot(data)
newdata = data * 0.2
newdata = newdata.astype(np.uint8)
print "Data type", newdata.dtype, "Shape", newdata.shape
scipy.io.wavfile.write("quiet.wav",
    sample_rate, newdata)
plt.subplot(2, 1, 2)
plt.title("Quiet")
plt.plot(newdata)
plt.show()
We will download a sound file and create a new version that is quieter:
- Reading a WAV file.
We will use standard Python code to download a sound file of Austin Powers exclaiming Smashing, baby. SciPy has a
wavfilesubpackage, which lets you load audio data or generate WAV files. If SciPy is installed, then we should already have this subpackage. Theread()function delivers a data array and sample rate. In this exercise, we are only concerned about the data.sample_rate, data = scipy.io.wavfile.read(WAV_FILE)
- Plot the original WAV data.
Plot the original WAV data with matplotlib and give the subplot the title
Original:plt.subplot(2, 1, 1) plt.title("Original") plt.plot(data) - Create a new array.
Now, we will use NumPy to produce a hushed sound sample. It is just a matter of making a new array with smaller values by multiplying it with a constant. This is where the trick of broadcasting happens. At the end, we want to be certain that we have the same data type as in the original array because of the WAV format.
newdata = data * 0.2
newdata = newdata.astype(np.uint8)
- Write to a WAV file.
This new array can be saved in a new WAV file as follows:
scipy.io.wavfile.write("quiet.wav", sample_rate, newdata) - Plot the new WAV data.
Plot the new data array with matplotlib as follows:
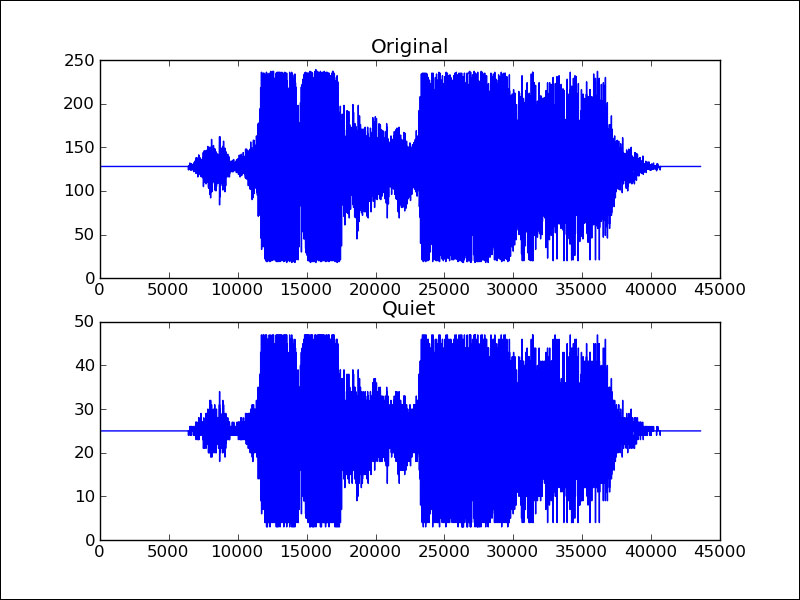
plt.subplot(2, 1, 2) plt.title("Quiet") plt.plot(newdata) plt.show() - The result is a diagram of the original WAV file data and a new array with smaller values, as depicted in the following figure: