
Clustering aims to partition data into groups called clusters. Clustering is usually unsupervised in the sense that no examples are given. Some clustering algorithms require a guess for the number of clusters, while other algorithms don't. Affinity propagation falls in the latter category. Each item in a dataset can be mapped into Euclidean space using feature values. Affinity propagation depends on a matrix containing Euclidean distances between data points. Since the matrix can quickly become quite large, we should be careful not to take up too much memory. The scikit-learn library has utilities to generate structured data. Create three data blobs, as follows:
x, _ = datasets.make_blobs(n_samples=100, centers=3, n_features=2, random_state=10)
Call the euclidean_distances() function to create the aforementioned matrix:
S = euclidean_distances(x)
Cluster using the matrix in order to label the data with the corresponding cluster:
aff_pro = cluster.AffinityPropagation().fit(S)
labels = aff_pro.labels_
If we plot the cluster, we get the following figure:
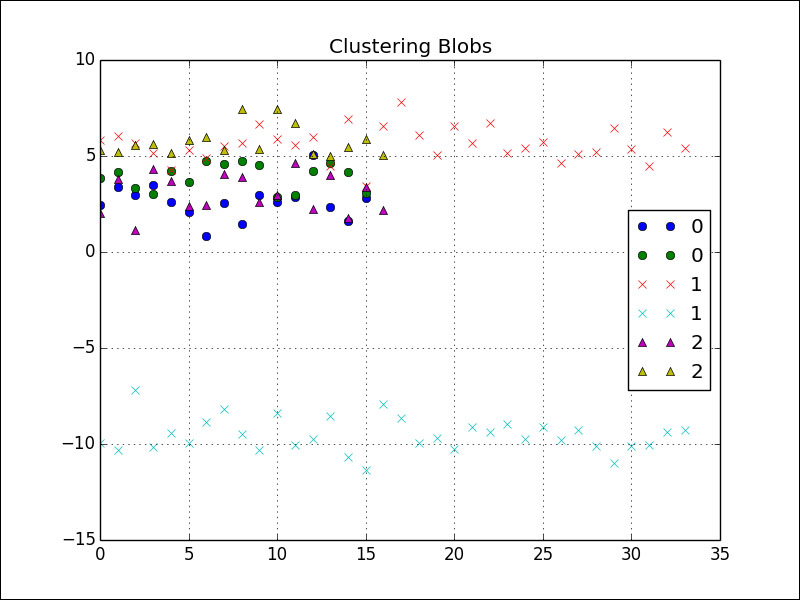
Refer to the aff_prop.py file in this book's code bundle:
from sklearn import datasets
from sklearn import cluster
import numpy as np
import matplotlib.pyplot as plt
from sklearn.metrics import euclidean_distances


x, _ = datasets.make_blobs(n_samples=100, centers=3, n_features=2, random_state=10)
S = euclidean_distances(x)

aff_pro = cluster.AffinityPropagation().fit(S)
labels = aff_pro.labels_

styles = ['o', 'x', '^']

for style, label in zip(styles, np.unique(labels)):
   print label
   plt.plot(x[labels == label], style, label=label)
plt.title("Clustering Blobs")
plt.grid(True)
plt.legend(loc='best')
plt.show()