
Social network analysis studies social relations using network theory. Nodes represent participants in a network. Lines between nodes represent relationships. Formally, this is called a graph. Due to the constraints of this book, we will only have a quick look at a simple graph that comes with the popular NetworkX Python library. matplotlib will help with the visualization of the graph.
Install NetworkX with the following commands:
$ pip install networkx
$ pip freeze|grep networkx
networkx==1.9
The import convention for NetworkX is as follows:
import networkx as nx
NetworkX provides a number of sample graphs, which can be listed as follows:
print [s for s in dir(nx) if s.endswith('graph')]Load the Davis Southern women graph and plot a histogram of the degree of connections:
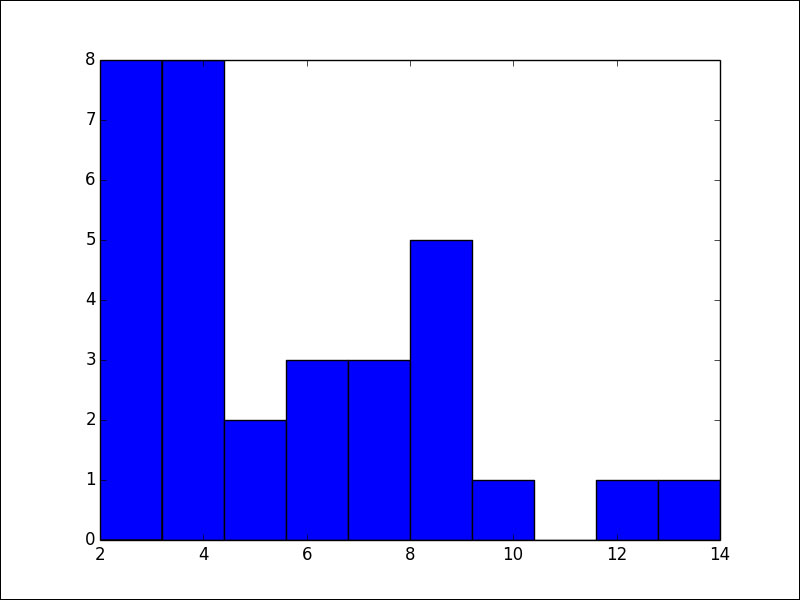
G = nx.davis_southern_women_graph()
plt.figure(1)
plt.hist(nx.degree(G).values())
The resulting histogram is shown as follows:
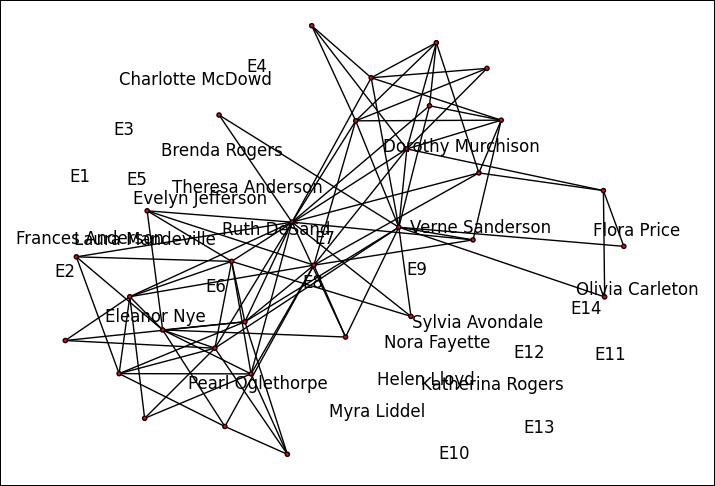
Draw the graph with node labels as follows:
plt.figure(2)
pos = nx.spring_layout(G)
nx.draw(G, node_size=9)
nx.draw_networkx_labels(G, pos)
plt.show()
We get the following graph:
This was a short example, but it should be enough to give you a taste of what is possible. We can use NetworkX to explore, visualize, and analyze social media networks such as Twitter, Facebook, and LinkedIn. The subject matter doesn't even have to be a social network, it can be anything that resembles a graph and NetworkX understands.