
The if a: else b statement is one of the most common statements in Python programming. By nesting and combining such statements, we can build a so-called
decision tree. This is similar to an old-fashioned flowchart, although flowcharts also allow loops. The application of decision trees in machine learning is called decision tree learning. The end nodes of the trees in decision tree learning, also known as
leaves, contain the class labels of a classification problem. Each non-leaf node is associated with a Boolean condition involving feature values. The scikit-learn implementation uses Gini impurity and entropy as information metrics. These metrics measure the probability that an item is misclassified (see http://en.wikipedia.org/wiki/Decision_tree_learning). Decision trees are easy to understand, use, visualize, and verify. To visualize the tree, we will make use of Graphviz, which can be downloaded from http://graphviz.org/. Also, we need to install pydot2, as follows:
$ pip install pydot2
$ pip freeze|grep pydot2
pydot 2==1.0.33
Split the rain data into a training and test set as follows, with the scikit-learn train_test_split() function:
x_train, x_test, y_train, y_test = train_test_split(x, y, random_state=37)
Create DecisionTreeClassifier as follows:
clf = tree.DecisionTreeClassifier(random_state=37)
We will use the scikit-learn RandomSearchCV class to try out a range of parameters. Use the class as follows:
params = {"max_depth": [2, None],
              "min_samples_leaf": sp_randint(1, 5),
              "criterion": ["gini", "entropy"]}
rscv = RandomizedSearchCV(clf, params)
rscv.fit(x_train,y_train)
We get the following best score and parameters from the search:
Best Train Score 0.703164923517
Test Score 0.705058763413
Best params {'criterion': 'gini', 'max_depth': 2, 'min_samples_leaf': 2}
It's good to visualize the decision tree even if it's only to verify our assumptions. Create a decision tree figure with the following code:
sio = StringIO.StringIO()
tree.export_graphviz(rscv.best_estimator_, out_file=sio, feature_names=['day-of-year','yest'])
dec_tree = pydot.graph_from_dot_data(sio.getvalue())

with NamedTemporaryFile(prefix='rain', suffix='.png', delete=False) as f:
    dec_tree.write_png(f.name)
    print "Written figure to", f.name
Refer to the following plot for the end result:
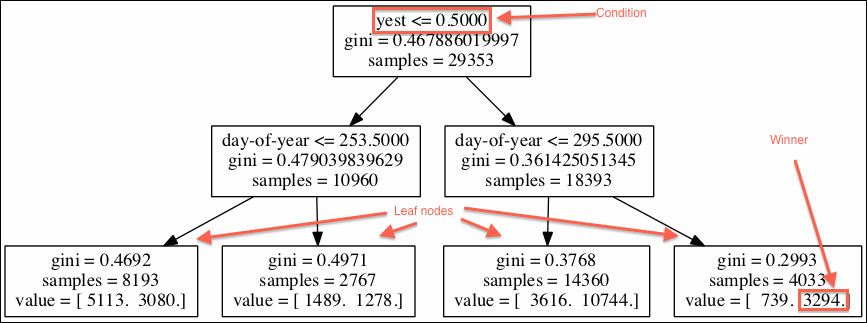
In the non-leaf nodes, we see conditions printed as the top line. If the condition is true, we go to the left child; otherwise, we go to the right. When we reach a leaf node, the class with highest value, as given in the bottom line, wins. Inspect the dec_tree.py file in this book's code bundle:
from sklearn.cross_validation import train_test_split
from sklearn import tree
from sklearn.grid_search import RandomizedSearchCV
from scipy.stats import randint as sp_randint
import pydot
import StringIO
import numpy as np
from tempfile import NamedTemporaryFile

rain = .1 * np.load('rain.npy')
rain[rain < 0] = .05/2
dates = np.load('doy.npy').astype(int)
x = np.vstack((dates[:-1], np.sign(rain[:-1])))
x = x.T

y = np.sign(rain[1:])

x_train, x_test, y_train, y_test = train_test_split(x, y, random_state=37)

clf = tree.DecisionTreeClassifier(random_state=37)
params = {"max_depth": [2, None],
              "min_samples_leaf": sp_randint(1, 5),
              "criterion": ["gini", "entropy"]}
rscv = RandomizedSearchCV(clf, params)
rscv.fit(x_train,y_train)

sio = StringIO.StringIO()
tree.export_graphviz(rscv.best_estimator_, out_file=sio, feature_names=['day-of-year','yest'])
dec_tree = pydot.graph_from_dot_data(sio.getvalue())

with NamedTemporaryFile(prefix='rain', suffix='.png', delete=False) as f:
    dec_tree.write_png(f.name)
    print "Written figure to", f.name

print "Best Train Score", rscv.best_score_
print "Test Score", rscv.score(x_test, y_test)
print "Best params", rscv.best_params_