Fourier analysis is based on the Fourier series named after the mathematician Joseph Fourier. The Fourier series is a mathematical method used to represent functions as an infinite series of sine and cosine terms. The functions in question can be real or complex valued:
The most efficient algorithm for Fourier analysis is the Fast Fourier Transform (FFT). This algorithm is implemented in SciPy and NumPy. When applied to the time series data, the Fourier analysis transforms maps onto the frequency domain, producing a frequency spectrum. The frequency spectrum displays harmonics as distinct spikes at certain frequencies. Music, for example, is composed from different frequencies with the note A at 440 Hz. The note A can be produced by a pitch fork. We can produce this and other notes with musical instruments such as a piano. White noise is a signal consisting of many frequencies, which are represented equally. White light is a mix of all the visible frequencies of light, also represented equally.
In the following example, we will import two functions (refer to fourier.py):
from scipy.fftpack import rfft
from scipy.fftpack import fftshift
The rfft() function performs FFT on real-valued data. We could also have used the fft() function, but it gives a warning on this particular dataset. The fftshift() function shifts the zero-frequency component (the mean of the data) to the middle of the spectrum, for better visualization. We will also have a look at a sine wave because that is easy to understand. Create a sine wave and apply the FFT to it:
t = np.linspace(-2 * np.pi, 2 * np.pi, len(sunspots))
mid = np.ptp(sunspots)/2
sine = mid + mid * np.sin(np.sin(t))

sine_fft = np.abs(fftshift(rfft(sine)))
print "Index of max sine FFT", np.argsort(sine_fft)[-5:]
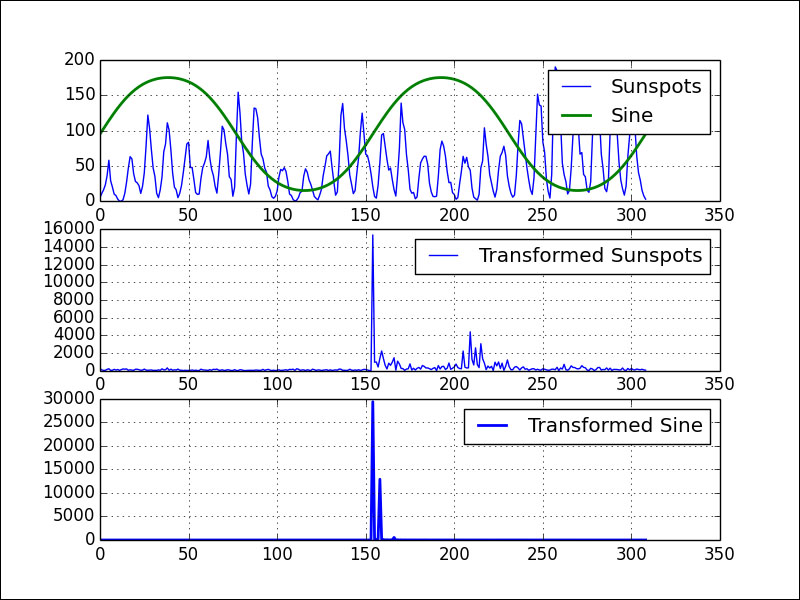
The following is the output that shows the indices corresponding to maximum amplitudes:
Index of max sine FFT [160 157 166 158 154]
Perform FFT on the sunspots data:
transformed = np.abs(fftshift(rfft(sunspots)))
print "Indices of max sunspots FFT", np.argsort(transformed)[-5:]
The five largest peaks in the spectrum can be found at the following indices:
Indices of max sunspots FFT [205 212 215 209 154]
The largest peak is situated at 154 too. Refer to the following plot for the end result:

The complete code is located in the fourier.py file in this book's code bundle:
import numpy as np
import statsmodels.api as sm
import matplotlib.pyplot as plt
from scipy.fftpack import rfft
from scipy.fftpack import fftshift

data_loader = sm.datasets.sunspots.load_pandas()
sunspots = data_loader.data["SUNACTIVITY"].values

t = np.linspace(-2 * np.pi, 2 * np.pi, len(sunspots))
mid = np.ptp(sunspots)/2
sine = mid + mid * np.sin(np.sin(t))

sine_fft = np.abs(fftshift(rfft(sine)))
print "Index of max sine FFT", np.argsort(sine_fft)[-5:]


transformed = np.abs(fftshift(rfft(sunspots)))
print "Indices of max sunspots FFT", np.argsort(transformed)[-5:]

plt.subplot(311)
plt.plot(sunspots, label="Sunspots")
plt.plot(sine, lw=2, label="Sine")
plt.grid(True)
plt.legend()
plt.subplot(312)
plt.plot(transformed, label="Transformed Sunspots")
plt.grid(True)
plt.legend()
plt.subplot(313)
plt.plot(sine_fft, lw=2, label="Transformed Sine")
plt.grid(True)
plt.legend()
plt.show()
