
R provides a datasets package that contains sample datasets. The morley dataset has data from measurements of the speed of light made in 1879. The speed of light is a fundamental physical constant and its value is currently known very precisely. The data is described at http://stat.ethz.ch/R-manual/R-devel/library/datasets/html/morley.html. The speed of light value can be found in the scipy.constants module. The R data is stored in an R dataframe with three columns:
- The experiment number from one to five
- The run number with twenty runs per experiment, bringing the total measurements to 100
- The measured speed of light in kilometers per second with 299,000 subtracted
The rpy2.robjects.r() function executes R code in a Python environment. Load the data as follows:
ro.r('data(morley)')The pandas library provides an R interface via the pandas.rpy.common module. Load the data into a pandas DataFrame as follows:
df = com.load_data('morley')Let's group the data by experiment with the following code, which creates a five by two NumPy array:
samples = dict(list(df.groupby('Expt')))
samples = np.array([samples[i]['Speed'].values for i in samples.keys()])
When we have data from different experiments, it's interesting to know whether the data points of these experiments come from the same distribution. The Kruskal-Wallis one-way analysis of variance (refer to http://en.wikipedia.org/wiki/Kruskal%E2%80%93Wallis_one-way_analysis_of_variance) is a statistical method, which analyzes samples without making assumptions about their distributions. The null hypothesis for this test is that all the medians of the samples are equal. The test is implemented in the scipy.stats.kruskal() function. Perform the test as follows:
print "Kruskal", kruskal(samples[0], samples[1], samples[2], samples[3], samples[4])
The test statistic and p-value are printed in the following line:
Kruskal (15.022124661246552, 0.0046555484175328015)
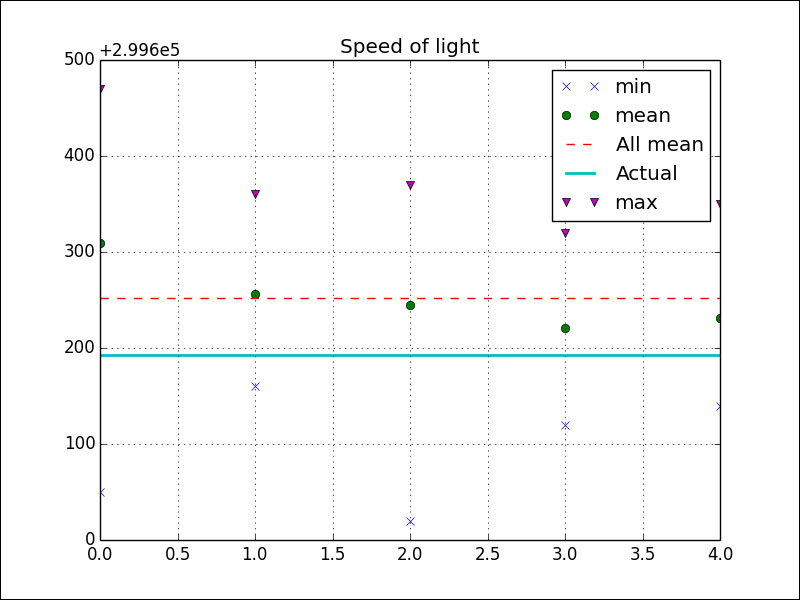
We can reject the null hypothesis, but this doesn't tell us which experiment or experiments have a deviating median. Further analysis is left as an exercise for the reader. If we plot the minimum, maximum, and means for each experiment, we get the following figure:
Check out the r_demo.py file in this book's code bundle:
import pandas.rpy.common as com
import rpy2.robjects as ro
from scipy.stats import kruskal
import matplotlib.pyplot as plt
import numpy as np
from scipy.constants import c


ro.r('data(morley)')
df = com.load_data('morley')
df['Speed'] = df['Speed'] + 299000

samples = dict(list(df.groupby('Expt')))
samples = np.array([samples[i]['Speed'].values for i in samples.keys()])
print "Kruskal", kruskal(samples[0], samples[1], samples[2], samples[3], samples[4])

plt.title('Speed of light')
plt.plot(samples.min(axis=1), 'x', label='min')
plt.plot(samples.mean(axis=1), 'o', label='mean')
plt.plot(np.ones(5) * samples.mean(), '--', label='All mean')
plt.plot(np.ones(5) * c/1000, lw=2, label='Actual')
plt.plot(samples.max(axis=1), 'v', label='max')
plt.grid(True)
plt.legend()
plt.show()