
Data is often messy and contains gaps or characters that we do not deal with often. Masked arrays can be utilized to disregard absent or invalid data points. A masked array from the numpy.ma subpackage is a subclass of ndarray with a mask. In this section, we will use the Lena Soderberg photo as the data source and act as if some of this data is corrupt. The following is the full code for the masked-array example from the masked.py file in this book's code bundle:
import numpy
import scipy
import matplotlib.pyplot as plt

lena = scipy.misc.lena()
random_mask = numpy.random.randint(0, 2, size=lena.shape)

plt.subplot(221)
plt.title("Original")
plt.imshow(lena)
plt.axis('off')

masked_array = numpy.ma.array(lena, mask=random_mask)
print masked_array

plt.subplot(222)
plt.title("Masked")
plt.imshow(masked_array)
plt.axis('off')

plt.subplot(223)
plt.title("Log")
plt.imshow(numpy.log(lena))
plt.axis('off')

plt.subplot(224)
plt.title("Log Masked")
plt.imshow(numpy.log(masked_array))
plt.axis('off')

plt.show()
Finally, we will display the original picture, logarithm values of the original image, the masked array, and logarithm values thereof:
- Create a mask.
To produce a masked array, we have to stipulate a mask. Let's create a random mask. This mask will have values that are either 0 or 1:
random_mask = numpy.random.randint(0, 2, size=lena.shape)
- Create a masked array.
By applying the mask in the former step, create a masked array:
masked_array = numpy.ma.array(lena, mask=random_mask)
The resulting pictures are exhibited as follows:

We applied a random mask to NumPy arrays. This resulted in disregarding the data matching the mask. There is an entire range of masked-array procedures to be discovered in the numpy.ma subpackage. In this tutorial, we only presented how to produce a masked array.
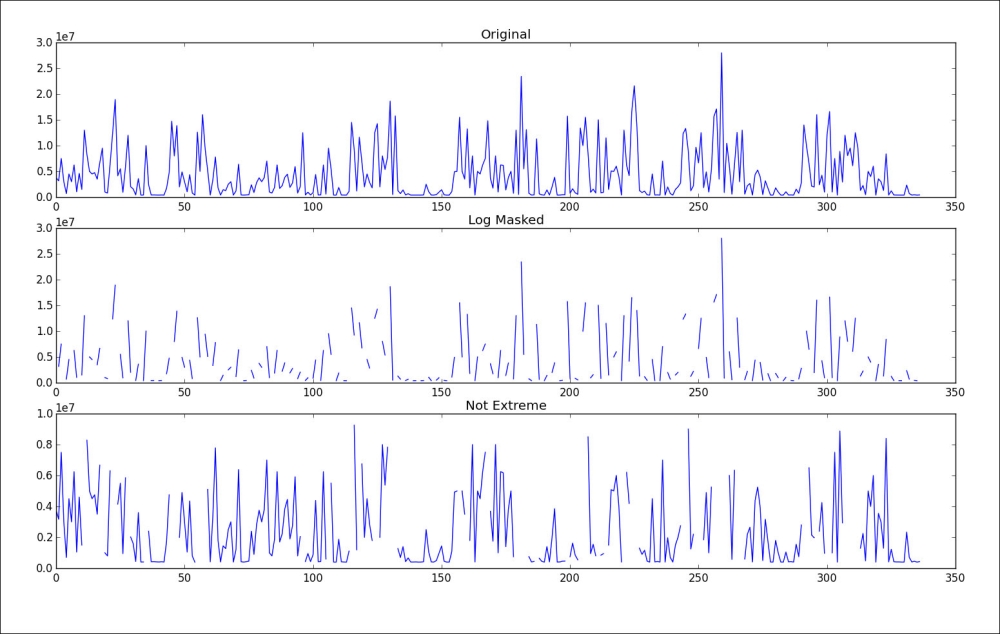
Masked arrays are useful when we desire to ignore negative values, for example, when taking the logarithm of array values. A second use case for masked arrays is rejecting outliers. This works based on a higher and lower limit for extreme values. In this tutorial, we will apply these techniques to the salary data of players in the MLB. The data comes originally from http://www.exploredata.net/Downloads/Baseball-Data-Set. The data was edited to contain two columns: the player name and salary. This resulted in MLB2008.csv, which can be found in the code bundle. The full script for this tutorial is in the masked_funcs.py file in this book's code bundle:
import numpy as np
from matplotlib.finance import quotes_historical_yahoo
from datetime import date
import sys
import matplotlib.pyplot as plt

salary = np.loadtxt("MLB2008.csv", delimiter=',', usecols=(1,), skiprows=1, unpack=True)
triples = np.arange(0, len(salary), 3)
print "Triples", triples[:10], "..."

signs = np.ones(len(salary))
print "Signs", signs[:10], "..."

signs[triples] = -1
print "Signs", signs[:10], "..."

ma_log = np.ma.log(salary * signs)
print "Masked logs", ma_log[:10], "..."

dev = salary.std()
avg = salary.mean()
inside = np.ma.masked_outside(salary, avg - dev, avg + dev)
print "Inside", inside[:10], "..."

plt.subplot(311)
plt.title("Original")
plt.plot(salary)

plt.subplot(312)
plt.title("Log Masked")
plt.plot(np.exp(ma_log))

plt.subplot(313)
plt.title("Not Extreme")
plt.plot(inside)

plt.show()
The following are the steps that will help you execute the aforementioned commands:
- Taking the logarithm of negative numbers.
We will take the logarithm of an array that holds negative numbers. Firstly, let's create an array holding numbers divisible by three:
triples = numpy.arange(0, len(salary), 3)
print "Triples", triples[:10], "..."
Next, we will produce an array with ones that have the same size as the salary data array:
signs = numpy.ones(len(salary))
print "Signs", signs[:10], "..."
We will set up each third array element to be negative with the aid of indexing tricks we acquired in Chapter 2, NumPy Arrays:
signs[triples] = -1
print "Signs", signs[:10], "..."
In conclusion, we will take the logarithm of this array:
ma_log = numpy.ma.log(salary * signs)
print "Masked logs", ma_log[:10], "..."
This ought to print the following for the salary data:
Triples [ 0  3  6  9 12 15 18 21 24 27] ...
Signs [ 1.  1.  1.  1.  1.  1.  1.  1.  1.  1.] ...
Signs [-1.  1.  1. -1.  1.  1. -1.  1.  1. -1.] ...
Masked logs [-- 14.970818190308929 15.830413578506539 -- 13.458835614025542
 15.319587954740548 -- 15.648092021712584 13.864300722133706 --] ...
- Ignoring extreme values.
Let's specify outliers as being one standard deviation below the mean or one standard deviation above the mean (this is not necessarily a correct definition that is given here because it is easy to compute). This definition directs us to compose the following code, which will mask extreme points:
dev = salary.std()
avg = salary.mean()
inside = numpy.ma.masked_outside(salary, avg - dev, avg + dev)
print "Inside", inside[:10], "..."
The following code displays the output for the initial 10 elements:
Inside [3750000.0 3175000.0 7500000.0 3000000.0 700000.0 4500000.0 3000000.0
 6250000.0 1050000.0 4600000.0] ...
Let's plot the original salary data, the data after taking the logarithm and the exponent back again, and finally the data after applying the standard deviation-based mask.
It will look something like this:
Functions in the numpy.ma subpackage mask array elements, which we view as invalid. For example, negative values are not allowed for the log() and sqrt() functions. A masked value is like a NULL value in relational databases and programming. All operations with a masked value deliver a masked value.