We installed matplotlib and IPython in Chapter 1, Getting Started with Python Libraries. Please go back to that chapter if you need to. The procedural MATLAB-like matplotlib API is considered by many as simpler to use than the object-oriented API, so we will demonstrate this procedural API first. To create a very basic plot in matplotlib, we need to invoke the plot() function in the matplotlib.pyplot subpackage. This function produces a two-dimensional plot for a single list or multiple lists of points with known x and y coordinates.
Optionally, we can pass a format parameter, for instance, to specify a dashed line style. The list of format options and parameters for the plot() function is pretty long, but easy to look up with the following commands:
$ ipython -pylab
In [1]: help(plot)
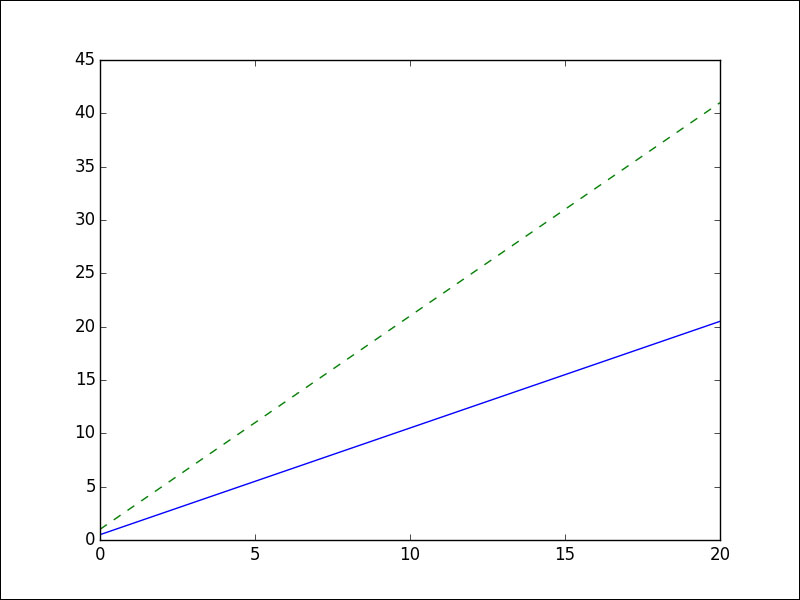
In this example, we will plot two lines: one with a solid line style (the default) and the other with a dashed line style.
The following demo code is in the basic_plot.py file in this book's code bundle:
import matplotlib.pyplot as plt
import numpy as np

x = np.linspace(0, 20)

plt.plot(x,  .5 + x)
plt.plot(x, 1 + 2 * x, '--')
plt.show()
Please follow the ensuing steps to plot the aforementioned lines:
- First, we will specify the x coordinates with the NumPy
linspace()function. Specify a start value of0and an end value of20:x = np.linspace(0, 20)
- Plot the lines as follows:
plt.plot(x,  .5 + x)
plt.plot(x, 1 + 2 * x, '--')
- At this juncture, we can either save the plot to a file with the
savefig()function or show the plot on the screen with theshow()function. Show the plot on the screen as follows:plt.show()
Refer to the following plot for the end result: