
ARMA models are often used to forecast a time series. These models combine autoregressive and moving average models (see http://en.wikipedia.org/wiki/Autoregressive%E2%80%93moving-average_model). In moving average models, we assume that a variable is the sum of the mean of the time series and a linear combination of noise components.
Note
The autoregressive and moving average models can have different orders. In general, we can define an ARMA model with p autoregressive terms and q moving average terms as follows:
In the preceding formula, just like in the autoregressive model formula, we have a constant and a white noise component; however, we try to fit the lagged noise components as well.
Fortunately, it's possible to use the statsmodelssm.tsa.ARMA() routine for this analysis. Fit the data to an ARMA(10,1) model as follows:
model = sm.tsa.ARMA(df, (10,1)).fit()
Perform a forecast (statsmodels uses strings a lot):
prediction = model.predict('1975', str(years[-1]), dynamic=True)Refer to the following plot for the end result:
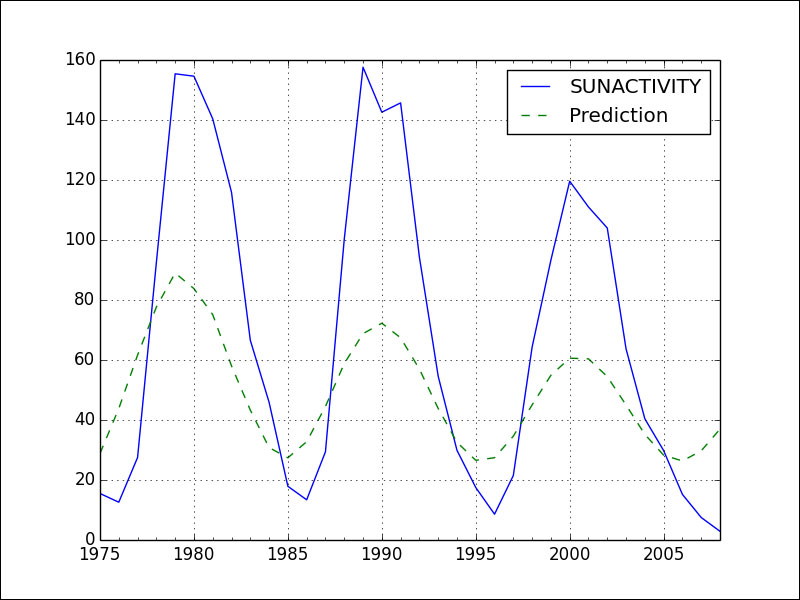
The fit is poor because frankly, we overfit the data. The simpler model in the previous section worked much better. The example code can be found in the arma.py file in this book's code bundle:
import pandas as pd
import matplotlib.pyplot as plt
import statsmodels.api as sm
import datetime

data_loader = sm.datasets.sunspots.load_pandas()
df = data_loader.data
years = df["YEAR"].values.astype(int)
df.index = pd.Index(sm.tsa.datetools.dates_from_range(str(years[0]), str(years[-1])))
del df["YEAR"]

model = sm.tsa.ARMA(df, (10,1)).fit()
prediction = model.predict('1975', str(years[-1]), dynamic=True)

df['1975':].plot()
prediction.plot(style='--', label='Prediction')
plt.legend()
plt.show()