
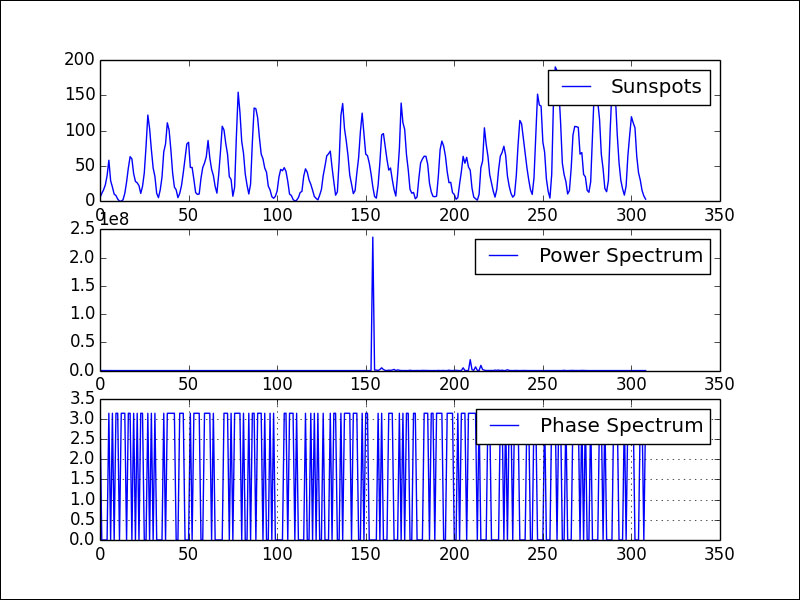
In the previous section, we charted the amplitude spectrum of the dataset. The power spectrum of a physical signal visualizes the energy distribution of the signal. We can modify the code easily to plot the power spectrum, just by squaring the values as follows:
plt.plot(transformed ** 2, label="Power Spectrum")
The phase spectrum visualizes the phase (the initial angle of a sine function) and can be plotted as follows:
plt.plot(np.angle(transformed), label="Phase Spectrum")
Refer to the following graph for the end result:
Please refer to the spectrum.py file in this book's code bundle for the complete code.
..................Content has been hidden....................
You can't read the all page of ebook, please click here login for view all page.