
The most important operations groupBy implements are aggregate, filter, transform, and apply. An efficient way of implementing aggregation functions in the dataset is by doing so after grouping the required columns. The aggregated function will return a single aggregated value for each group. Once these groups have been created, we can apply several aggregation operations to that grouped data.
Let's group the DataFrame, df, by body-style and drive-wheels and extract stats from each group by passing a dictionary of aggregation functions:
# Group the data frame df by body-style and drive-wheels and extract stats from each group
df.groupby(
   ["body-style","drive-wheels"]
).agg(
    {
         'height':min, # minimum height of car in each group
         'length': max, # maximum length of car in each group
         'price': 'mean', # average price of car in each group

    }
)
The output of the preceding code is as follows:
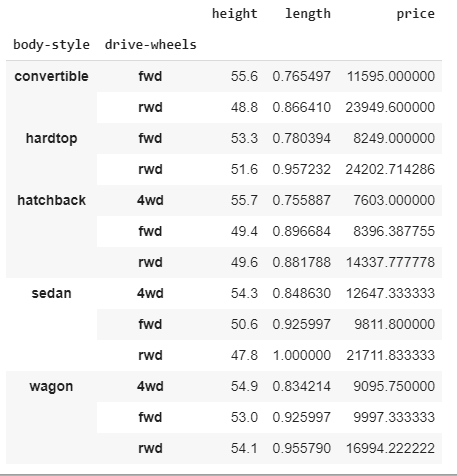
The preceding code groups the dataframe according to body-style and then driver-wheels. Then, the aggregate functions are applied to the height, length, and price columns, which return the minimum height, maximum length, and average price in the respective groups.
We can make an aggregation dictionary of functions we want to perform in groups, and then use it later:
# create dictionary of aggregations
aggregations=(
    {
         'height':min, # minimum height of car in each group
         'length': max, # maximum length of car in each group
         'price': 'mean', # average price of car in each group

    }
)
# implementing aggregations in groups
df.groupby(
   ["body-style","drive-wheels"]
).agg(aggregations)
The output of the preceding code is as follows:

We can use numpy functions in aggregation as well:
# import the numpy library as np
import numpy as np
# using numpy libraries for operations
df.groupby(
   ["body-style","drive-wheels"])["price"].agg([np.sum, np.mean, np.std])
The output of the preceding code is as follows:
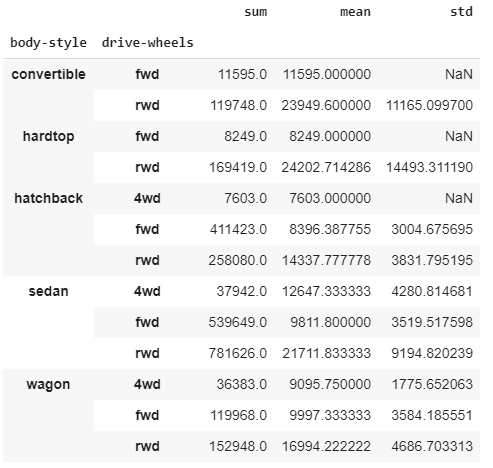
As shown in the preceding screenshot, we selected two categories, body-style and drive-wheels. The sum, mean, and standard deviation for each row can be seen here. Pretty straightforward, right? Now, let's learn how to rename grouped aggregated columns.