
Let's see some sample data from the red wine dataframe. Remember, we can use different methods to see the data from a dataframe, including pd.head(), pd.tail(), and pd.iloc():
- Here, I am going to check the entries between the 100th and 110th rows:
df_red.iloc[100:110]
The output of the preceding code is given here:

- In addition to this, we can see the datatypes for each column. Let's use the snippet given here:
df_red.dtypes
The output of the preceding code is as follows:
fixed acidity float64
volatile acidity float64
citric acid float64
residual sugar float64
chlorides float64
free sulfur dioxide float64
total sulfur dioxide float64
density float64
pH float64
sulphates float64
alcohol float64
quality int64
dtype: object
As shown in the preceding output, most of the columns are in float64 format, except the quality column, which is int64.
- We can also describe the dataframe to get more descriptive information. Do you remember the name of the method to do so? Of course, we use the pd.describe() method. Check out the snippet:
df_red.describe()
The output of the preceding code is given here:
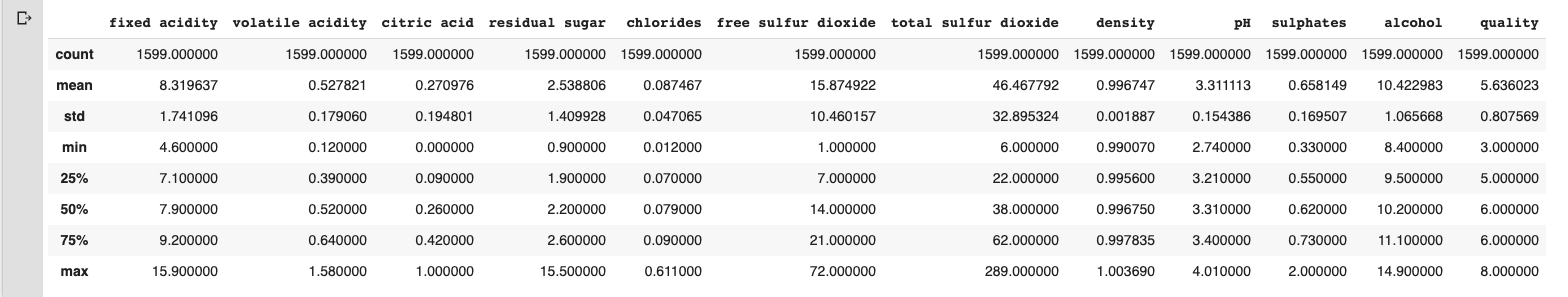
Note that Figure 12.2, which is the output of the pd.describe() method, indicates that each column has the same number of entries, 1,599, which is shown in the row count. By now, each row and column value should make sense. If you are still confused, we would highly recommend revising Chapter 5, Descriptive Statistics.